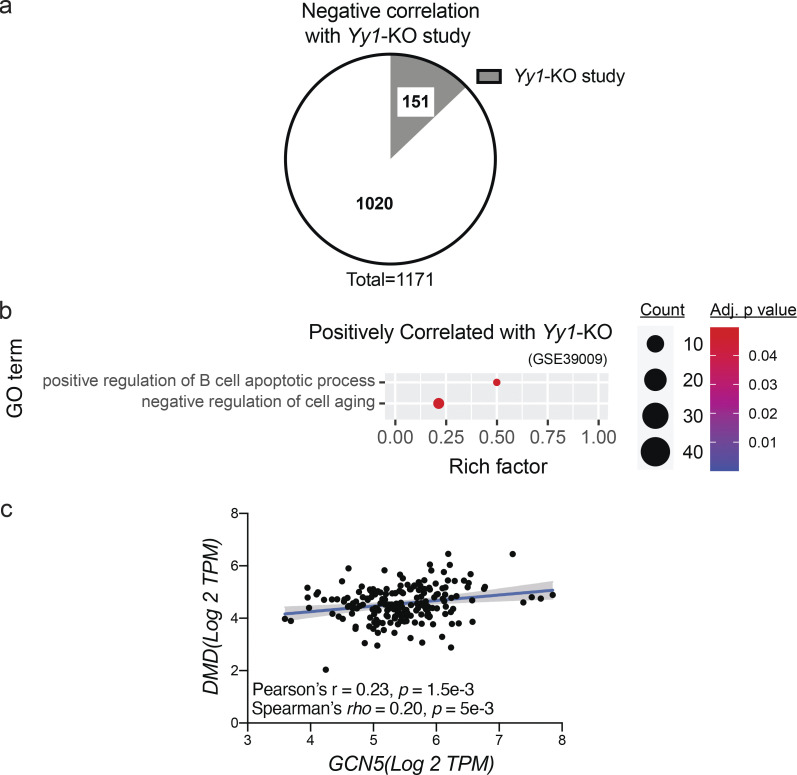
Figure S4.
Correlations between Gcn5skm−/− and Yy1-KO mouse biosets and between GCN5 and DMD gene expression in humans. (a) Pie chart representing negatively correlated genes between Gcn5skm−/− and Yy1-KO (Gene Expression Omnibus accession no. GSE39009) biosets following meta-analysis of the selected studies for down-regulated and up-regulated genes. (b) Bubble plot showing the distribution and size of positively correlated overrepresented GO pathways between the Gcn5skm−/− differentially expressed bioset and the Yy1-KO study bioset (Gene Expression Omnibus accession no. GSE39009). (c) Correlation between GCN5 and DMD gene expression as determined by RNA-seq in human skeletal muscle from the same 192 GTEx samples (GTExPortal database version 8) as in Fig. 4 e.

