Figure 1.
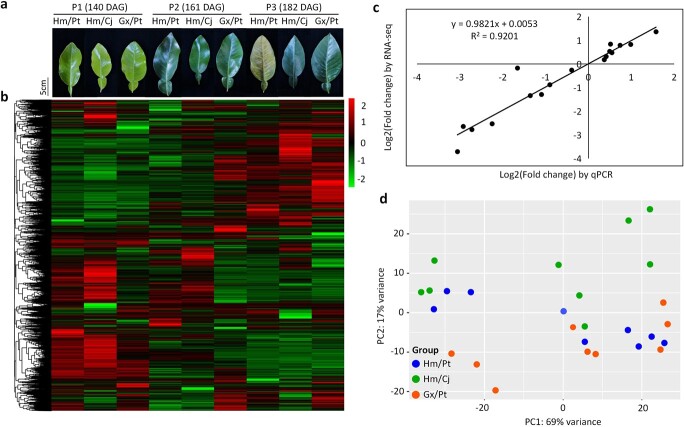
Transcriptome analysis of leaves. a Leaf samples at three phases (P1, P2, P3). b Hierarchical clustering of unigene expression. c Correlation of expression changes observed by RNA-seq (Y-axis) and qPCR (X-axis). d PCA of the samples sequenced by RNA-seq. The X-axis and Y-axes represent the first and second components. Dots with the same color indicate the same graft combination.

