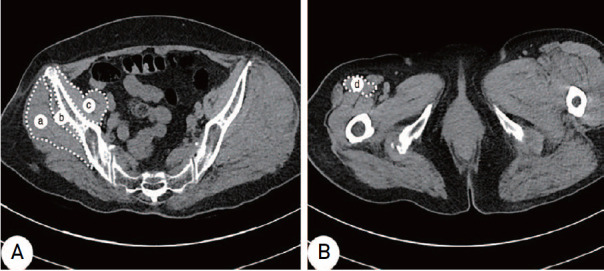
Fig. 2. The area of muscles is outlined by a white-dotted line in the axial scan of each level. (A) Cross-sectional area and attenuations of the gluteus medius (a), gluteus minimus (b), and iliopsoas (c) were measured at the sacroiliac joint just below level. (B) Cross-sectional area and attenuations of the rectus femoris (d) were measured at the lesser trochanter level.

