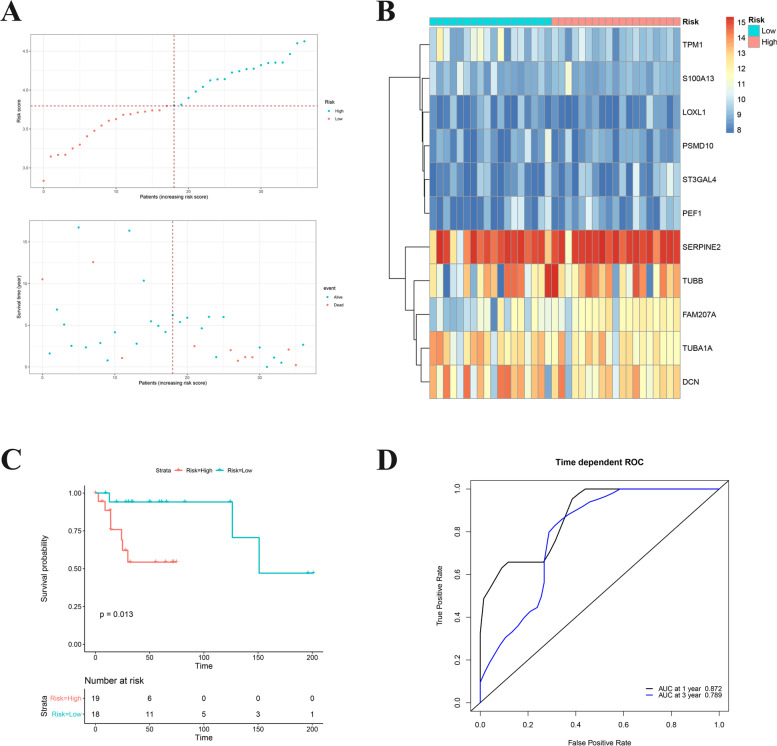
Fig. 7.
A Risk score analysis of the significantly survival-related ODRGs signatures in the TARGET OS cohorts were calculated. The upper figure showed that risk score curves of the significantly survival-related ODRGs signatures. The bottom figure showed that patient survival status and time distributed by the risk score. B Heatmap of 11 significantly survival-related ODRGs. C Kaplan–Meier analysis of different risk group in GSE39055 cohort. D The 1- and 3-year OS rates based on ODRGs signature in GSE39055 cohort were predicted by time-dependent ROC curve analysis

