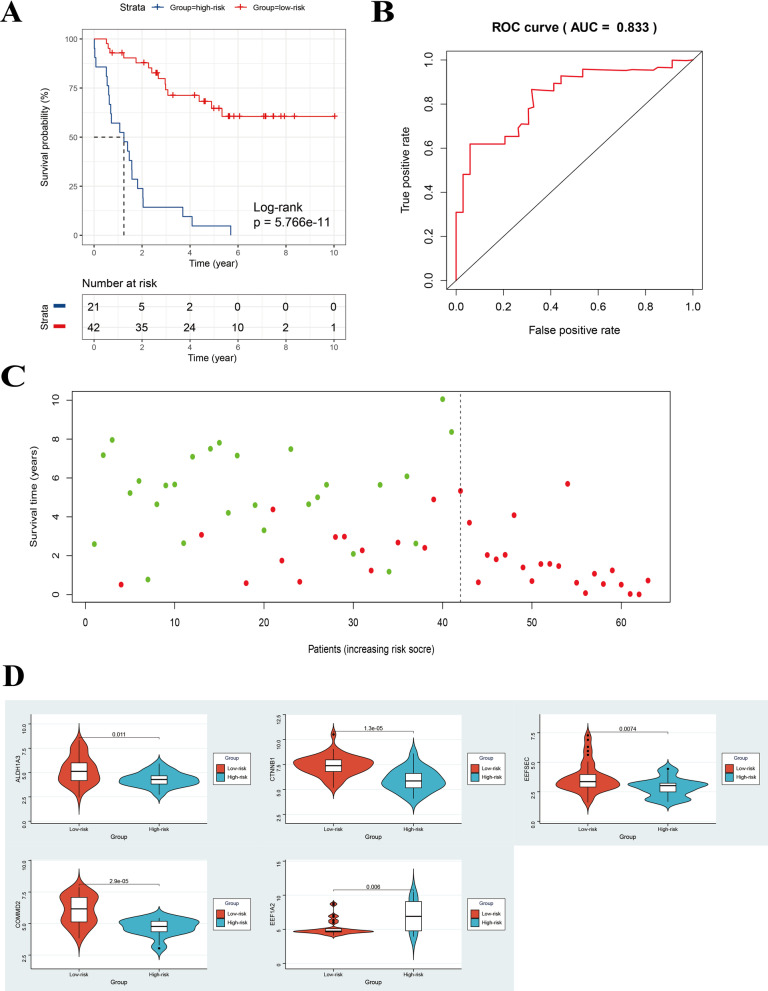
Fig. 4.
Assessment of prognostic value of the 5-gene signature in the training set. A Kaplan–Meier curve of patients with UM in the low- and high-risk groups of the training set GSE22138. B ROC curve for predicting accuracy of the 5-gene signature. C The risk scores and survival status of UM patients (one dot represents one UM patient, and the colors of the dots represent the survival status of patients; red color: dead, green color: alive). D The comparison of the expression of the five genes in low- and high-risk groups in the training cohort by Wilcoxon test. ROC, receiver operating characteristic

