
FIGURE 1.
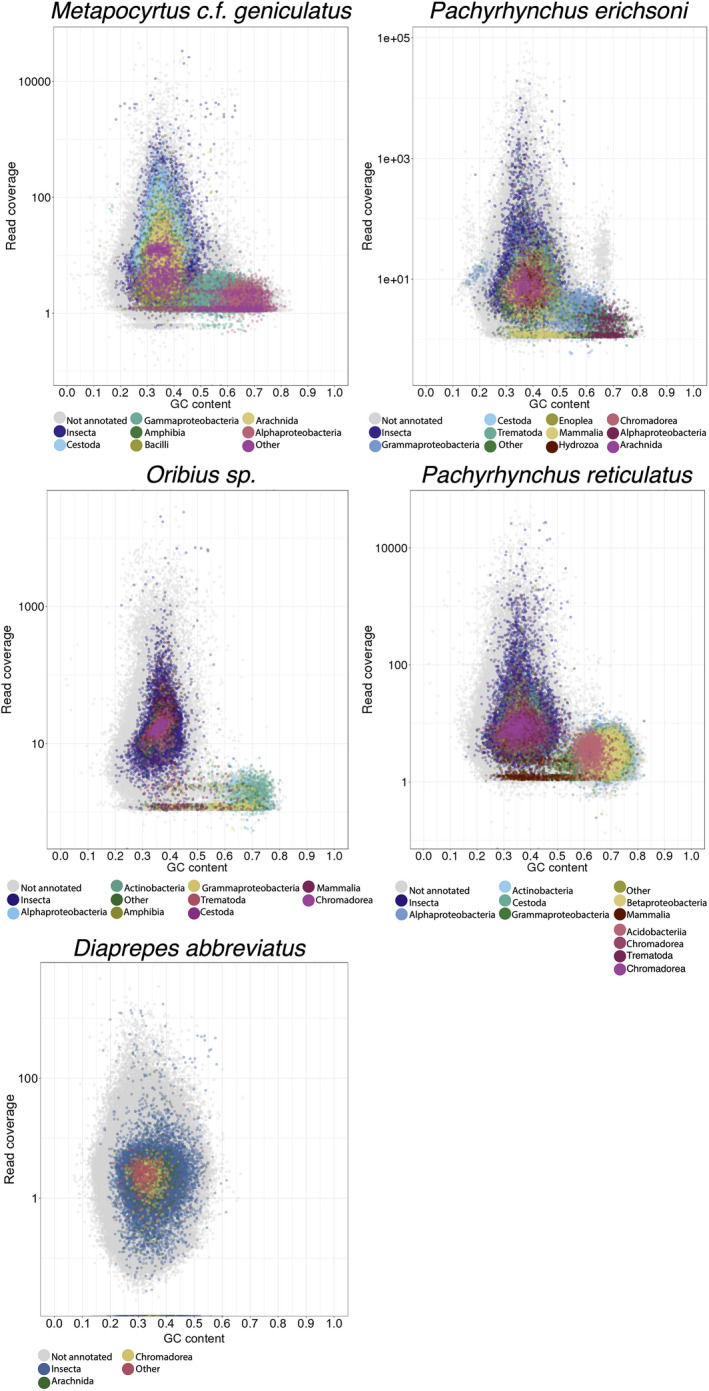
Blob plots of draft genome assembly scaffolds, Y‐axis is read coverage via the bwa‐mem algorithm, X‐axis is GC content of individual scaffolds. Color is coded by taxonomic class
Official websites use .gov
A
.gov website belongs to an official
government organization in the United States.
Secure .gov websites use HTTPS
A lock (
) or https:// means you've safely
connected to the .gov website. Share sensitive
information only on official, secure websites.
Blob plots of draft genome assembly scaffolds, Y‐axis is read coverage via the bwa‐mem algorithm, X‐axis is GC content of individual scaffolds. Color is coded by taxonomic class