FIGURE 2.

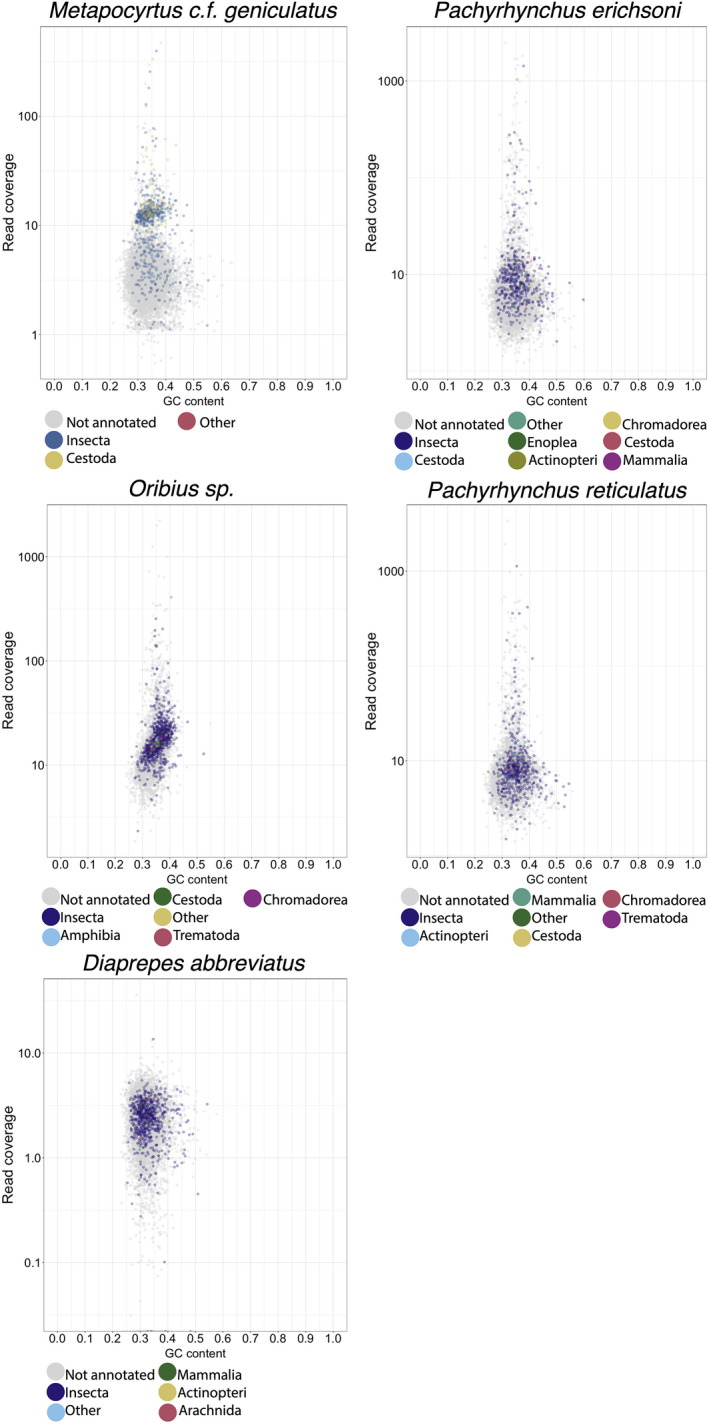
Blob plots of UCE‐bearing scaffolds from the master UCE probe set. The Y‐axis is read coverage via the bwa‐mem algorithm, and the X‐axis is the GC content of individual scaffolds. Color is coded by taxonomic class

Blob plots of UCE‐bearing scaffolds from the master UCE probe set. The Y‐axis is read coverage via the bwa‐mem algorithm, and the X‐axis is the GC content of individual scaffolds. Color is coded by taxonomic class