FIGURE 3.

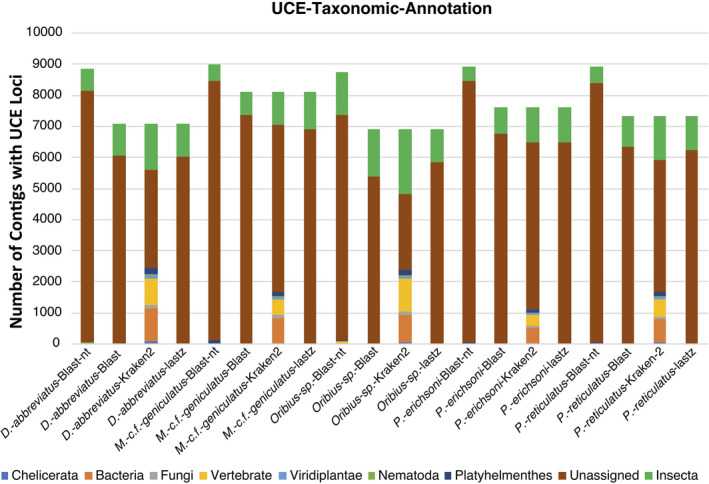
UCE bar chart. Y‐axis is the total number of UCEs, and the X‐axis is the method used to annotate associated species. Color is coded by taxonomic annotation

UCE bar chart. Y‐axis is the total number of UCEs, and the X‐axis is the method used to annotate associated species. Color is coded by taxonomic annotation