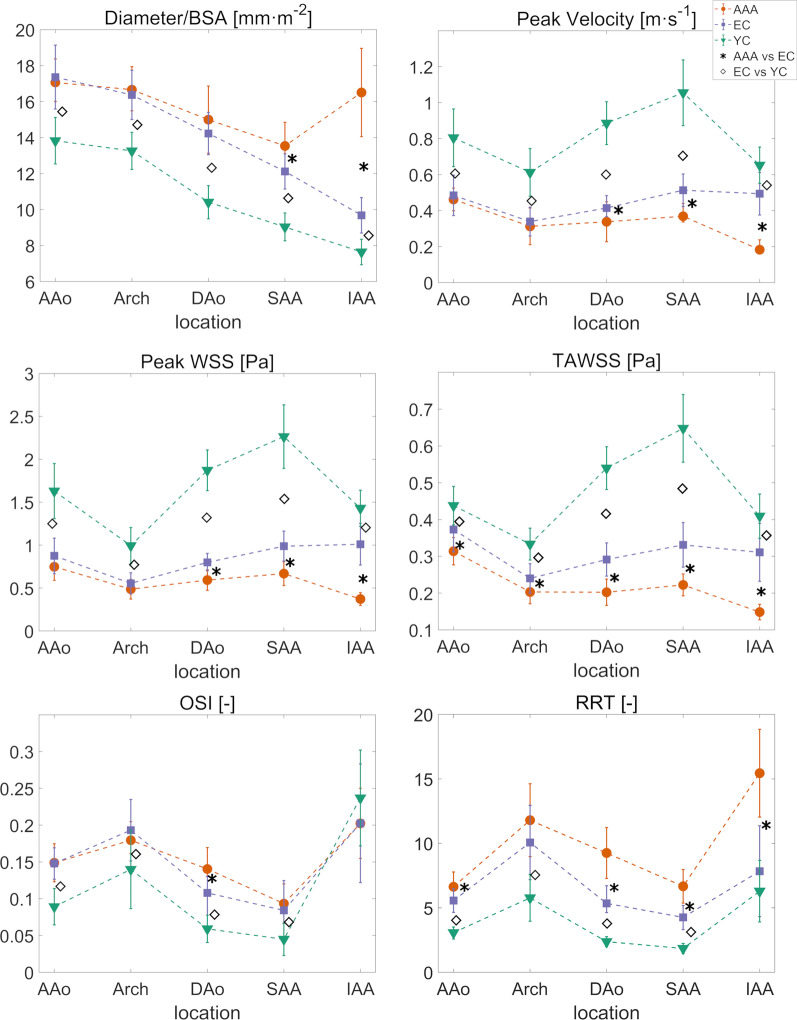
Fig. 2.
For each segment, average values of diameter normalized by body surface area (BSA), velocity, wall shear stress (WSS), time averaged wall shear stress (TAWSS), oscillatory shear index (OSI), and relative residence time (RRT) are represented for the three cohorts: AAA (red line with circular markers), elderly controls (blue line with squared markers), young controls (green line with triangles). Stars indicate significant difference between AAA and elderly controls (p < 0.025), diamonds between elderly and young controls (p < 0.025). Symbols and bars indicate mean and standard deviation in the cohort when the population is normally distributed, median and interquartile range values when not. EC elderly controls, YC young controls, SAA suprarenal abdominal aorta, IAA infrarenal abdominal aorta, DAo, descending aorta

