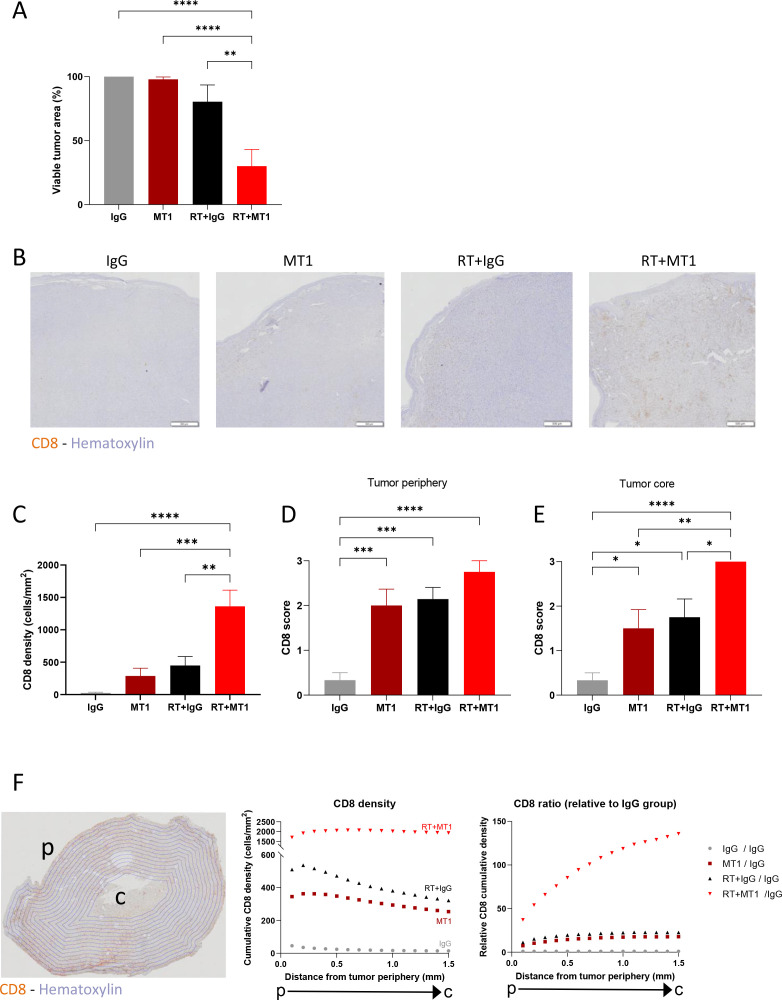
Figure 3.
MT1 favors in-depth cytotoxic T-cell infiltration in irradiated tumors. Mice-bearing TC1/Luc tumors were treated as in figure 1A, and tumor specimens were collected 6 days post-RT to perform histological analyses. (A) Histogram representing the percent of viable tumor for each group quantified by histological examination. (B) Representative images of CD8 staining by immunohistochemistry on head and neck tumors. (C) Quantification of CD8 T cell density per mm2. (D–E) Semiquantitative scoring of the CD8 density at the tumor periphery (D) and at the tumor core (E). (F) Scans of tumor sections were segmented in 0.1 mm concentric layers, as shown in the representative image (left panel). Quantification of CD8 T cell density was performed in each layer, and cumulative densities starting from the tumor periphery (p) to the tumor core (c) for each group are reported in the middle panel. The right panel shows the ratio of CD8 in each group relative to the IgG group. For all panels, n=8–9 mice from two independent experiments, *p<0.05; **p<0.01; ***p<0.001; ****:p<0.0001 (one-way ANOVA with Tukey’s multiple comparison test). RT, radiotherapy; ANOVA, analysis of variance.

