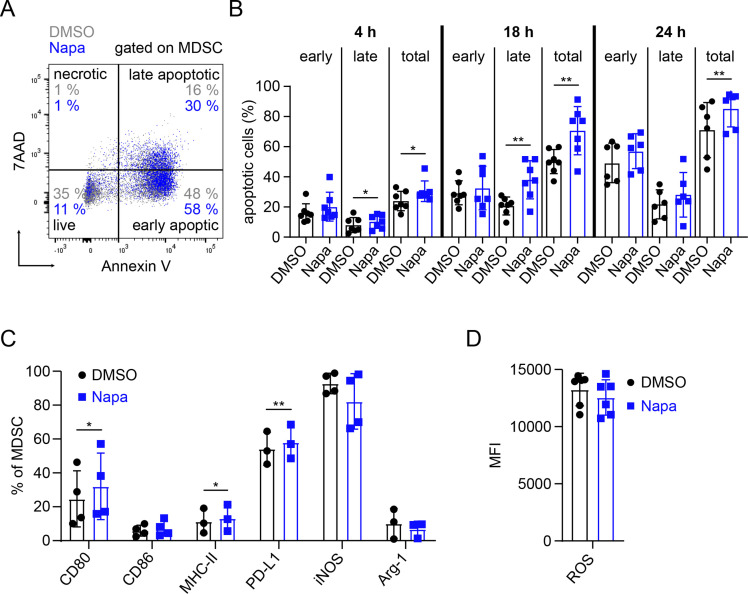
Figure 3.
Napabucasin promoted in vitro apoptosis and alteration of MDSC phenotype. MDSC generated in vitro were treated with 1 µM Napa or 0.01% DMSO. Apoptosis of MDSC and expression of their markers were measured by flow cytometry. (A) Gating strategy for determination of early (annexin V+7AAD−) and late apoptotic (annexin V+7AAD+), necrotic (annexin V−7AAD+) and live (annexin V−7AAD−) cells is shown. (B) Results are presented as the percentage of early, late and total apoptotic cells among total MDSC on 4, 18 and 24 hours of incubation with Napa (mean±SD, n=6–7). (C) Data are shown as the percentage of MDSC expressing CD80, CD86, MHC-II, PD-L1, iNOS and Arg-1 within total MDSC on 24 hours of culture with Napa (mean±SD, n=3–4). (D) The level of ROS production by MDSC is presented as MFI (mean±SD, n=6). *P<0.05, **P<0.01. Arg-1, arginase 1; iNOS, inducible nitric oxide synthase; MDSC, myeloid-derived suppressor cell; MFI, median fluorescence intensity; MHC-II, major histocompatibility complex class II; Napa, Napabucasin; PD-L1, programmed death ligand 1; ROS, reactive oxygen species.

