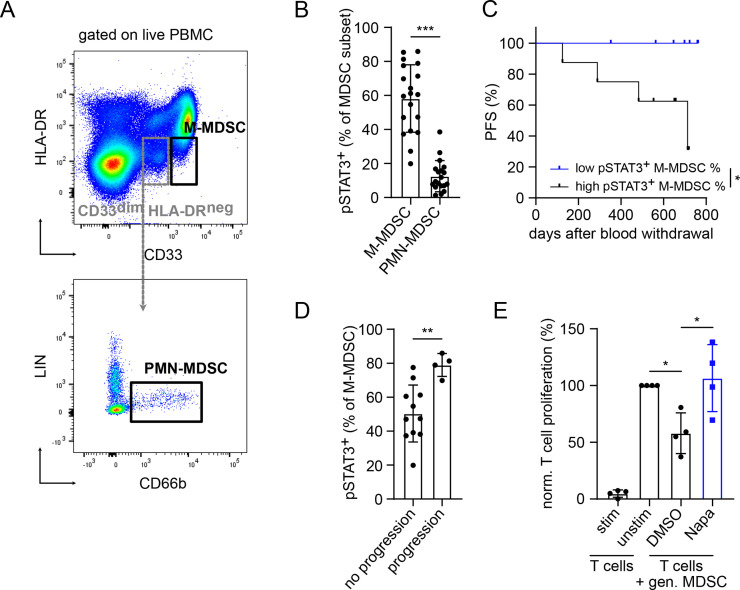
Figure 6.
STAT3 activation in MDSC from patients with melanoma and its inhibition by Napaucasin. PBMC from untreated patients with melanoma (stages I–IV) were analyzed by flow cytometry. (A) Representative dot plots for M-MDSC defined as CD33highHLA-DRlow/neg and PMN-MDSC defined as CD33dim HLA-DRnegCD66b+LIN− are presented. (B) Cumulative data are shown as the percentage of pSTAT3+ cells among respective MDSC subsets (mean±SD, n=19). pSTAT3+ MDSC were gated according to isotype control. (C) PFS of patients with high (>58.2%, n=8) and low (<58.2%, n=7) pSTAT3+ M-MDSC frequencies is shown as a Kaplan–Meier curve. Follow-up period was 2 years. (D) Cumulative data are presented as the percentage of pSTAT3+ M-MDSC within total M-MDSC in patients with (n=11) or without (n=4) progression. (E) Human M-MDSCs were generated in vitro for 4 days with IL-6 and GM-CSF followed by coculture with activated CD3+ T cells labeled with cell proliferation dye eFluor 450 in the presence of 0.5 µM Napa or 0.005% DMSO. On 96 hours of incubation, T-cell proliferation was assessed by proliferation dye dilution measured by flow cytometry. Cumulative data for T-cell proliferation are presented as the percentage of divided T cells norm. to the respective control of stimulated T cells alone (mean±SD, n=4). Statistics were performed on not norm. data. *P<0.05, **P<0.01, ***P<0.001. gen., generated; GM-CSF, granulocyte–macrophage colony-stimulating factor; IL, interleukin; MDSC, myeloid-derived suppressor cell; M-MDSC, monocytic myeloid-derived suppressor cell; Napa, Napabucasin; norm., normalized; PFS, progression-free survival; PMN, polymorphonuclear; STAT3, signal transducer and activator of transcription 3.

