
Figure 2. nsEMPEM shows predominant V3 targeting after the prime and initial boosts.
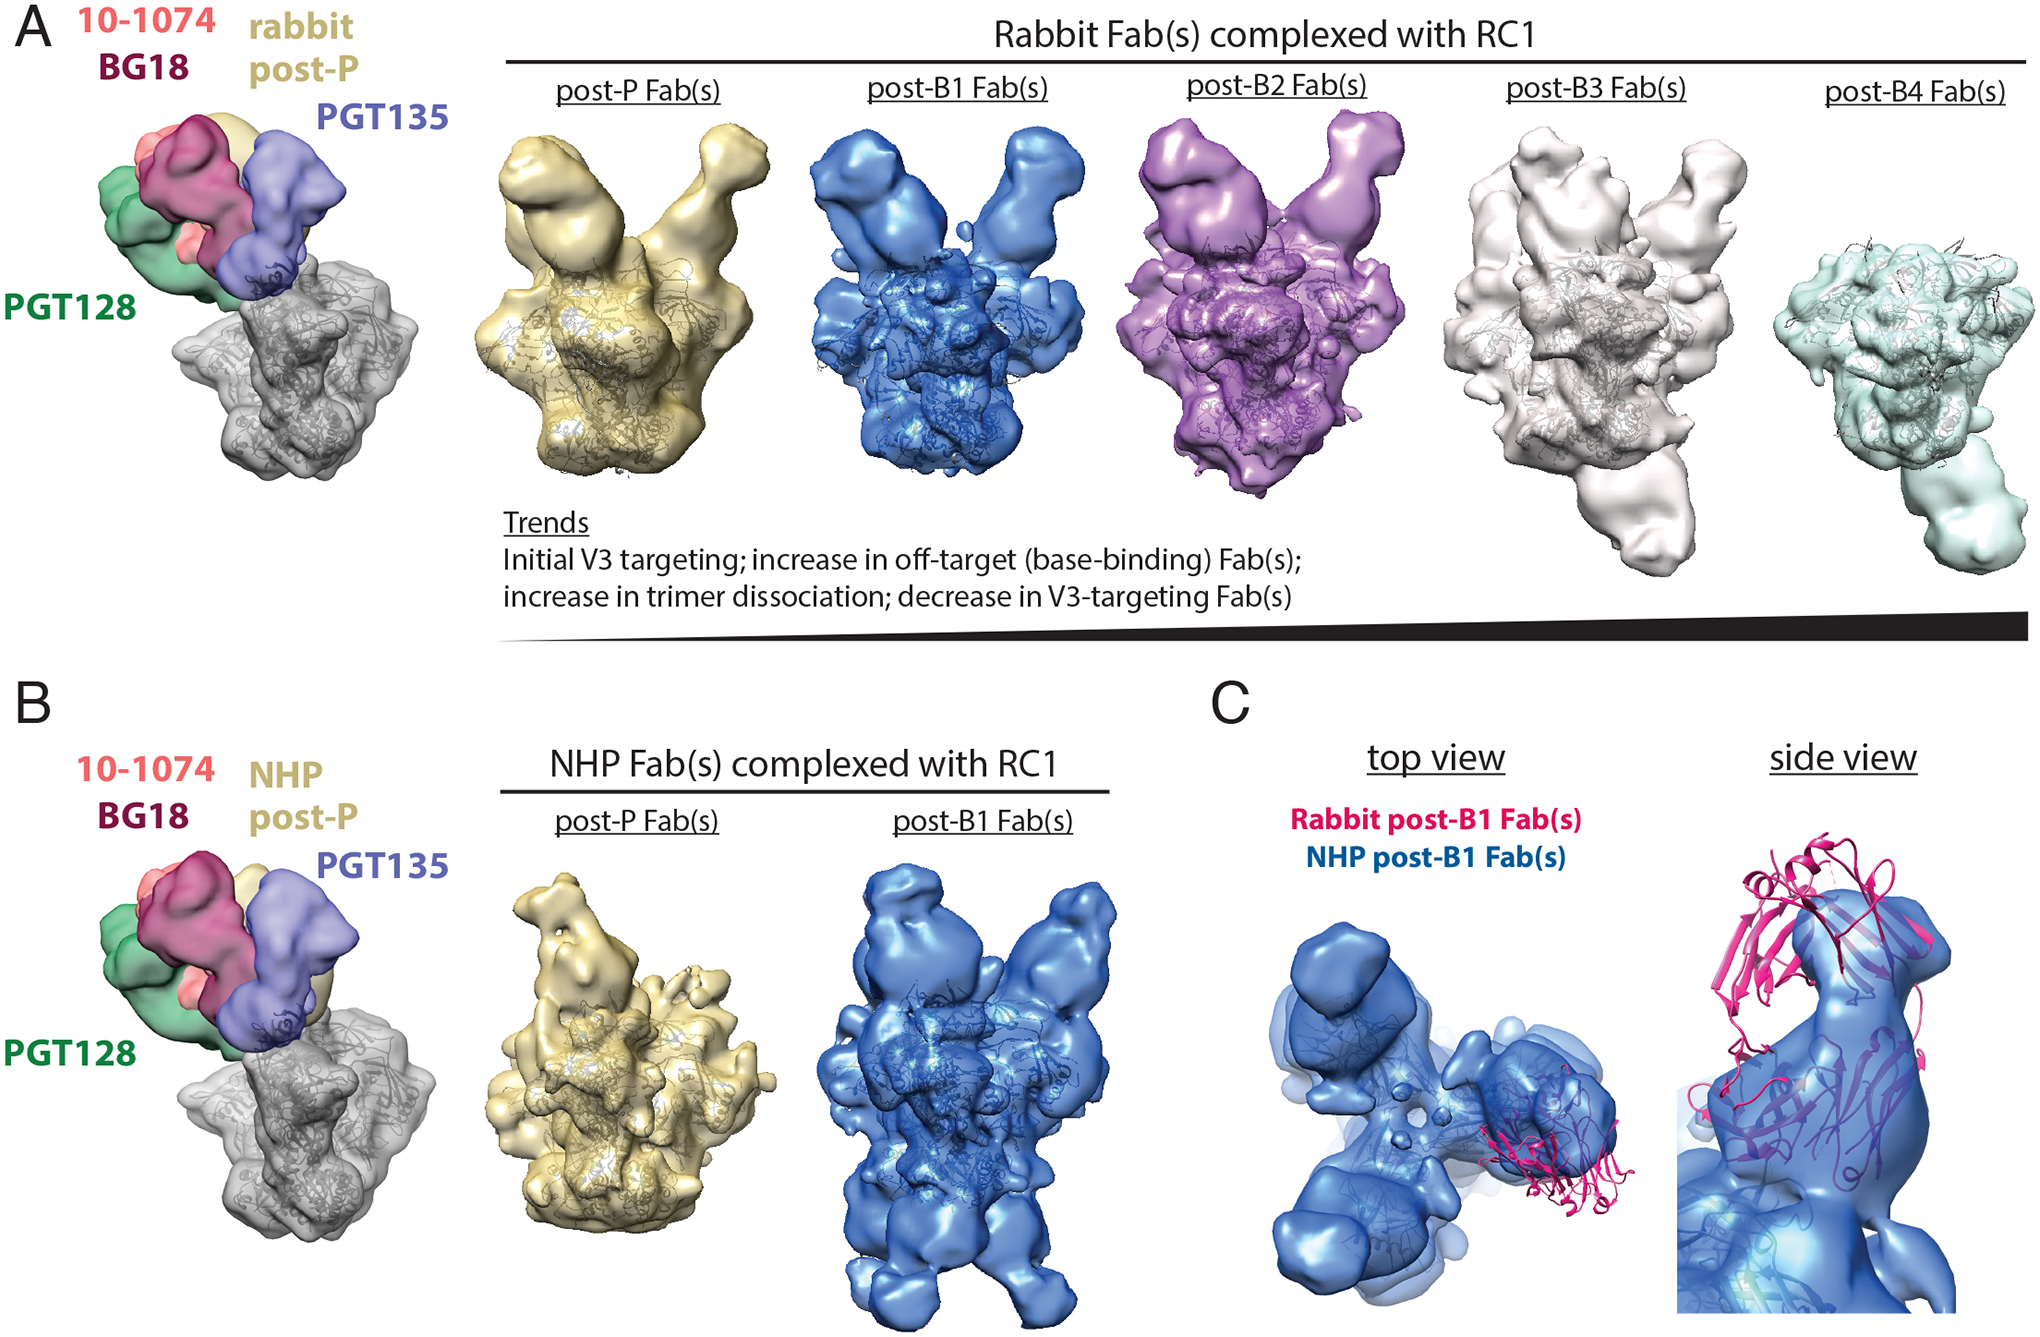
(A) Left: A low-pass filtered structure of representative HIV-1 SOSIP Env trimer is shown complexed with V3-glycan patch bNAb Fabs (PDB codes 5T3Z, 6CH8, 5C7K, 4JM2; colors as indicated) and post-P rabbit Fabs (gold) bound to one Env protomer. Polyclonal Fabs were isolated from Rabbit 2249 (fig. S2B), which received B41–5MUT-VLPs as Boost 2. Right 5 panels: 3D reconstructions of Fabs from antibodies isolated from a rabbit 2 weeks after P, B1, B2, B3, and B4 in complex with RC1 are shown. The predominant states for each time point are shown. See also fig. S3 and S5 for 2D classes, including bottom-binding Fabs after P, B1, and B2 and Fabs bound to dissociated protomers. Coordinates of RC1 (PDB 6ORN) were independently docked into EM density maps. (B) Left: A low-pass filtered structure of representative HIV-1 SOSIP Env trimer is shown complexed with V3-glycan patch bNAb Fabs (colors as indicated) and post-P NHP Fabs (gold) bound to one protomer. Polyclonal Fabs were isolated from NHP 1, which received B41–5MUT-VLPs as Boost 2 (Fig. 1A). Right: 3D reconstructions of Fabs from antibodies isolated from an immunized NHP 2 weeks after P and B1 are shown. See also fig. S4 for 2D classes showing bottom-binding Fabs. (C) Comparison of Fabs binding poses for rabbit and NHP nsEMPEM reconstructions are shown. Rabbit post-B1 Fabs are shown as a pink cartoon of PDB 5UD9 that was docked into the nsEMPEM 3D reconstruction; NHP post-B1 Fabs indicated by the density from the 3D reconstruction.