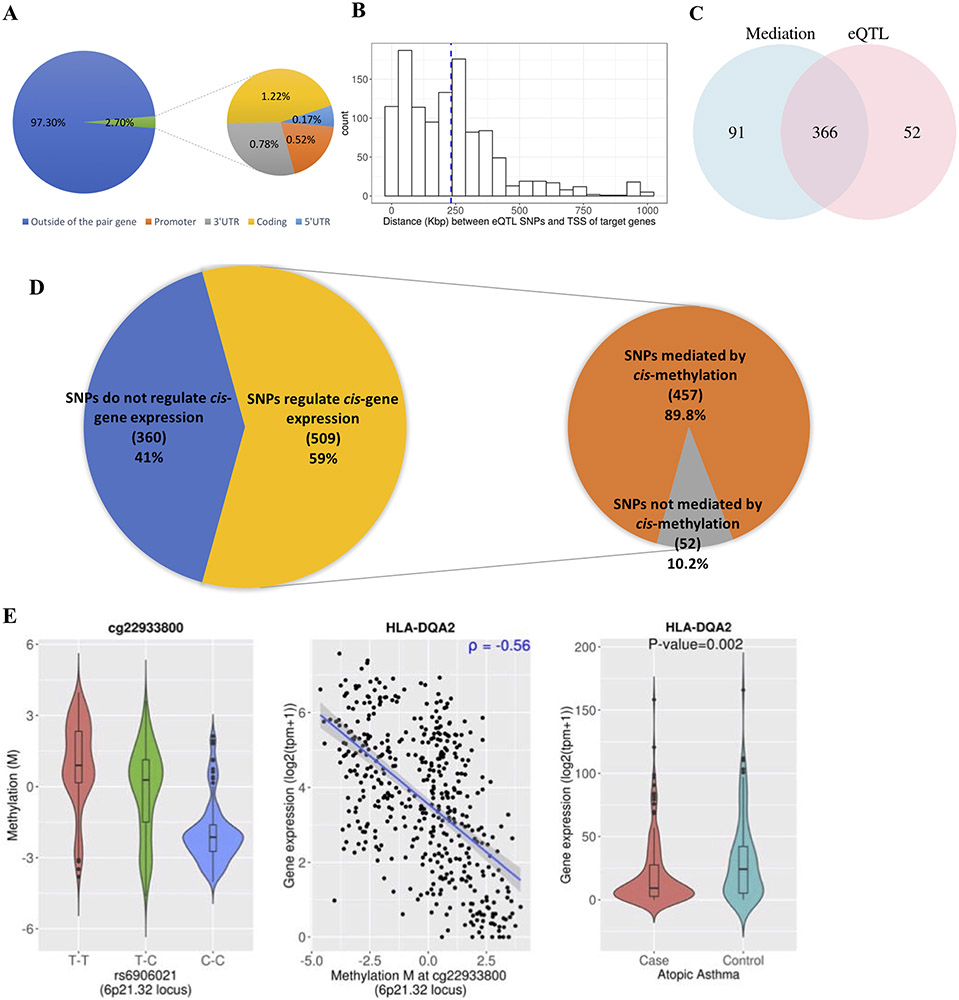
Figure 1. eQTL and mediation analysis of 869 TAGC SNPs.
(A) Percentage of eQTL SNPs that are located outside (blue) or inside (orange) of their paired gene region (Promoter – 5’UTR). When SNPs were associated with expression of multiple genes, they were counted multiple times. (B) Histogram of distance between eQTL SNPs and transcription start site of their associated genes (in Kb). (C) Venn diagram of the number of SNPs associated with gene expression (eQTL) (pink) and the number of SNPs associated with gene expression through mediation by methylation (blue). To test mediation effects of methylation between SNPs and gene expression, the Sobel test was conducted (at FDR-P < 0.05). (D) Composition of TAGC GWAS SNPs according to whether they are associated with cis-gene expression (left) and composition of the SNPs that regulate cis-gene expression, according to whether they are directly associated with gene expression (eQTL only) or indirectly associated with gene expression through mediation effects of methylation. (E) An example of a SNP that is indirectly associated with HLA-DQA2 gene expression through DNA methylation, and the gene is differentially expressed in atopic asthma. 1. Violin plots of the relationship between the eQTL SNP and an associated methylation probe (red, homozygous major allele; green, heterozygous; blue, homozygous minor allele) 2. Scatter plots of the relationship between DNA methylation and expression of the gene. 3. Violin plots of data from atopic asthmatic vs. those from non-atopic non-asthmatic controls against differential gene expression.

