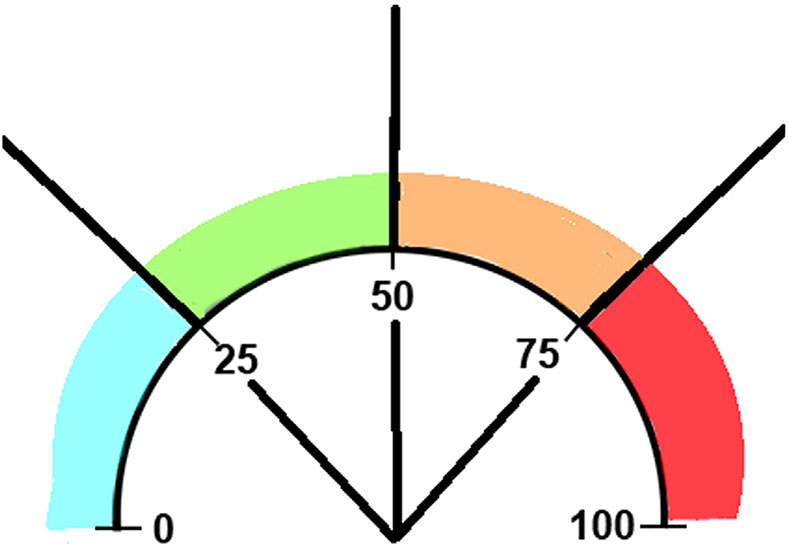
Figure 2.
SPEED map. Note. SPEED = self-perceived excess energy and distress. Blue = cool zone. At 0, the teen is totally relaxed and completely calm. As he or she approaches 25, there is an experience of mild distress and his or her energy levels are low. There is no interference with the teen’s ability to engage in activities. Green = go zone. As the teen moves away from 25 and toward 50, the distress becomes uncomfortable and/or energy levels are somewhat disruptive. Concentration is affected, but the teen is able to continue on. Orange = warning zone. As the teen moves from 50 toward 75, the distress is increasingly uncomfortable and/or excess energy is observable. The teen is preoccupied with the symptoms of distress and finds it very difficult to concentrate. The teen is considering escaping from the situation. Red = danger zone. At 100, the distress is at the highest the teen has ever experienced and/or he or she appears to be out of control. The teen is unable to concentrate or think rationally.

