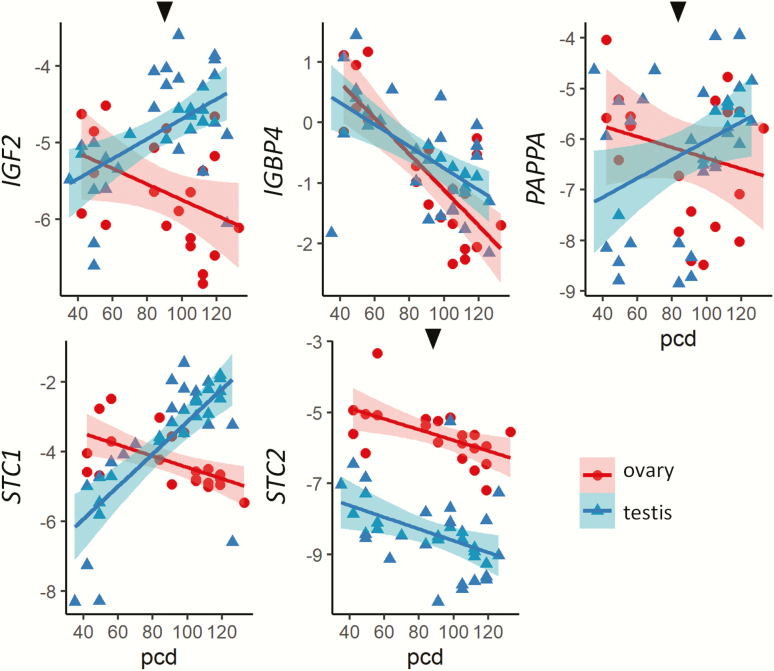
Figure 3.
Confirmation of microarray findings for a larger population. Relative transcript levels from qPCR analysis of 21 ovaries (42-133 pcd) and 34 testes (35-126 pcd) are shown. Black arrows above graphs indicate a 2-way significant interaction between sex, age, and expression levels. Shading indicates 95% confidence intervals. Abbreviation: pcd, postconception days.

