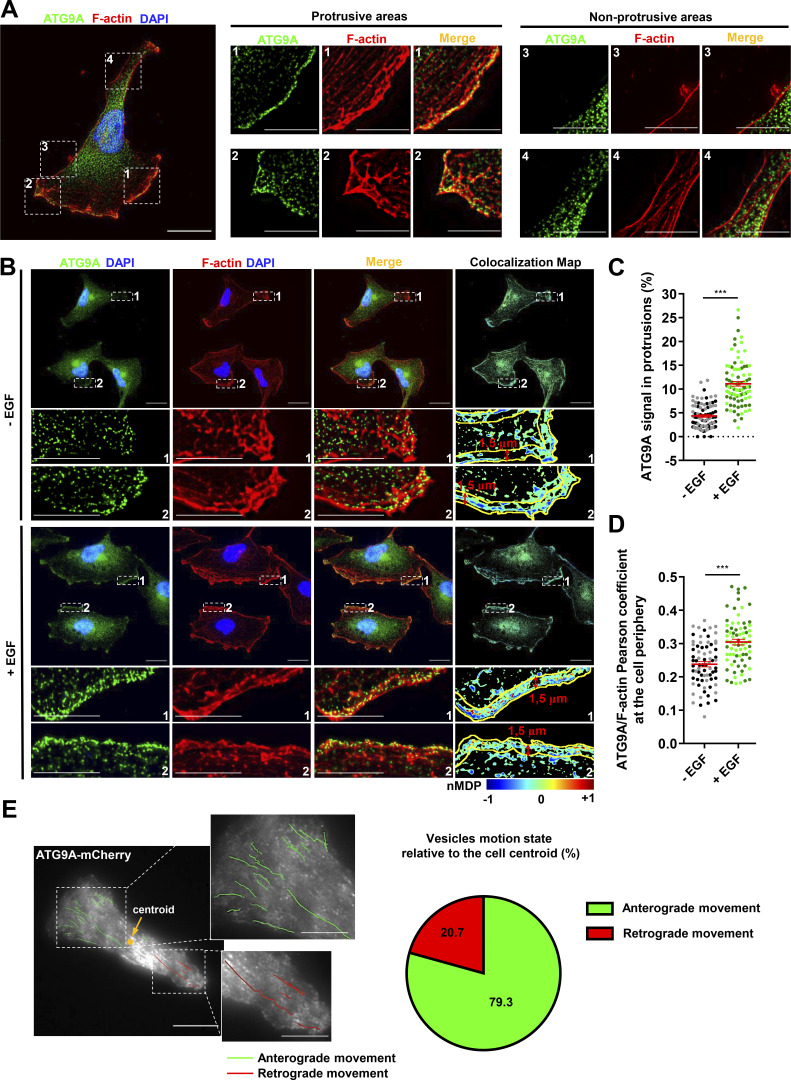
Figure 3.
ATG9A-positive vesicles concentrate in F-actin–rich protrusions and display anterograde trafficking toward the leading edge. (A) Endogenous ATG9A localizes in F-actin–rich cell protrusions. Left: U87 MG cells colabeled for endogenous ATG9A (green), F-actin (rhodamine phalloidin, red) and nuclei (DAPI labeling, blue). Scale bar, 20 µm. Middle and right: Magnified views of cell presented on the left panel, showing protrusive (middle) and nonprotrusive (right) areas. Scale bar for magnified views, 10 µm. (B) Chemotactic stimulation with EGF increases peripheral localization of ATG9A. U87 MG cells were starved (30 min) in serum-free medium and incubated (30 min) with or without EGF (50 ng/ml), as indicated. Cells were fixed and labeled for endogenous ATG9A (green), F-actin (rhodamine phalloidin, red), and DAPI (nuclei, blue). For each condition, a merged image and an ATG9A/F-actin colocalization map are shown. The association of ATG9A with F-actin was representatively shown with Colocalization Colormap tool, where normalized mean deviation product (nMDP) shows the correlation between intensities of corresponding pixels. Scale bar, 20 µm; magnified views, 10 µm. (C) Quantification from images shown in B of the fraction of the ATG9A signal located in F-actin–rich protrusions. For each cell, values correspond to the cumulated signal of all protrusions (−EGF, n = 88 cells; +EGF, n = 89 cells; from two independent experiments). (D) Quantification from images shown in B of the ATG9A/F-actin colocalization score (Pearson coefficient) at the cell periphery, in an ROI 1.5-µm width from the cell membrane. Data represent means ± SEM (−EGF, n = 73 cells; +EGF, n = 74 cells; from two independent experiments). (E) ATG9A-mCherry–positive vesicles display anterograde trafficking toward the leading edge. Left: Map of all observed (5-min period) ATG9A-mCherry vesicle trajectories from a representative polarized U87 MG cell. Trajectories were color-coded and defined as anterograde (green) or retrograde (red), as a function of vesicle displacement relative to the cell centroid. Scale bar, 20 µm; magnified views, 10 µm. Right: Pie chart showing the percentage of ATG9A-mCherry vesicles displaying anterograde or retrograde movement in cell protrusions (total number of 87 trajectories, recorded from four U87 MG polarized cells). Statistical significance was evaluated using Mann–Whitney U test. ***, P < 0.001.

