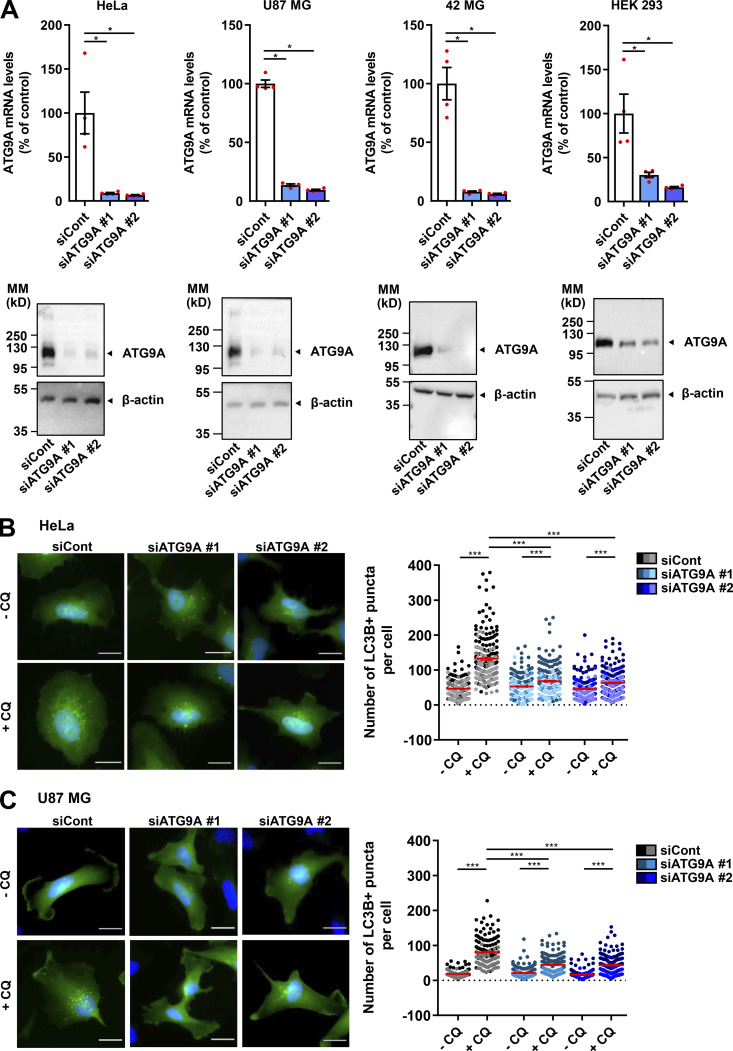
Figure S1.
Validation of ATG9A knockdown. (A) The indicated cell lines were transfected with nontargeting siRNA (siCont) or one of the two siRNAs targeting ATG9A (siATG9A #1, siATG9A #2). Upper panel: RT-qPCR analysis of ATG9A mRNA levels. Data show means ± SEM (n = 4). Lower panel: Western blot analysis of ATG9A protein levels. The blot was cut, and the upper and the lower parts were probed with antibodies against ATG9A and β-actin, respectively. MM, molecular mass. (B and C) Effect of siRNA knockdown of ATG9A on autophagosome biogenesis in HeLa cells (B) or U87 MG cells (C). Cells were transfected with nontargeting siRNA (siCont) or one of the two siRNAs targeting ATG9A (siATG9A #1, siATG9A #2), together with a construct encoding the EGFP-LC3B protein (marker of autophagosomes). Transfected cells were placed in serum-free medium for 6 h, in the presence or absence of CQ (5 × 10⁻⁵ M), as indicated. Cells were fixed, and the number of autophagosomes (EGFP-LC3B fluorescent dots) per cell was quantified. Data represent means ± SEM (n = 140–221 cells per group; cells from independent experiments were color-coded. Scale bar, 20 µm. Statistical significance was evaluated using Mann–Whitney U test (A) or one-way ANOVA followed by Sidak post hoc test (B and C). *, P < 0.05; ***, P < 0.001.

