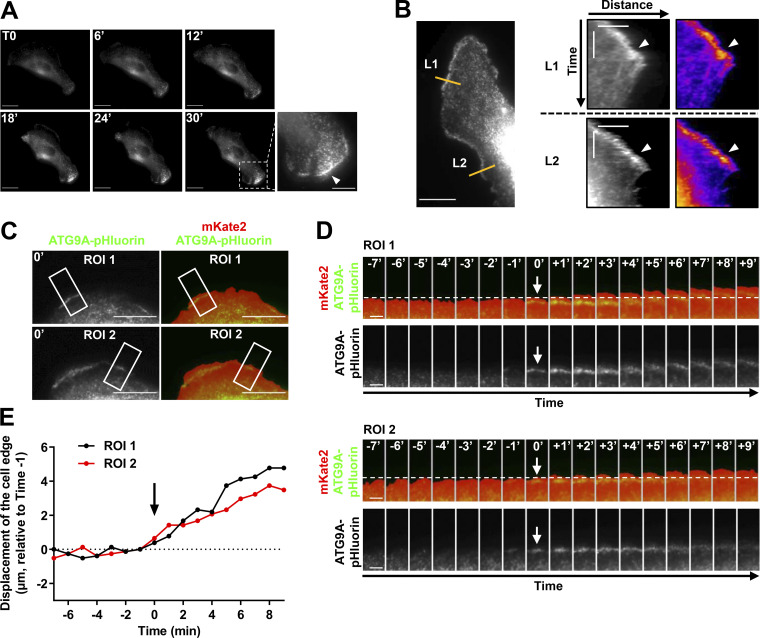
Figure S3.
ATG9A-pHluorin signal at the cell periphery correlates with protrusive activity. (A) Time-lapse TIRF images of a U87 MG cell expressing ATG9A-pHluorin. The development of a large cell protrusion correlates with the appearance of a marked pHluorin signal at the leading edge. A magnified image of the leading edge (dashed rectangle) is presented in the lower right and shows numerous ATG9A-pHluorin positive vesicles (arrowhead). Scale bar, 20 µm; magnified view, 10 µm. (B) Left: TIRF image extracted from a time-lapse sequence of a U87 MG cell expressing ATG9A-pHluorin. Scale bar, 20 µm. Right: Kymographs were made from 10-pixel-wide lines (L1 and L2) indicated in the left image. The scale bars in the kymograph are 5 µm (horizontal) and 10 min (vertical). A clear ATG9A-pHluorin signal was observed near the cell edge during the formation of protrusions (arrowheads). The signal sharply decreased during protrusion collapses. (C) TIRF image of a U87 MG cell expressing mKate2 (red) and ATG9A-pHluorin (green). The mKate2 protein, diffusely expressed in the cytosol, was used to precisely delineate the cell edges. Scale bar, 20 µm. (D) Time-lapse montage of ROI 1 and ROI 2 shown in C. For each time-lapse, time 0 represents the time of appearance of ATG9A-pHluorin–positive vesicles (arrows) near to the cell edge. The position of the cell edge before the appearance of the ATG9A-pHluorin signal is marked by a dashed line. Scale bar, 5 µm. (E) Displacements of the cell edges shown in ROI 1 and 2 were plotted against time. The position of the cell edge 1 min before the appearance of the ATG9A-pHluorin signal was set at 0, and positive values in the y axis represent cell protrusion.

