Figure S5.
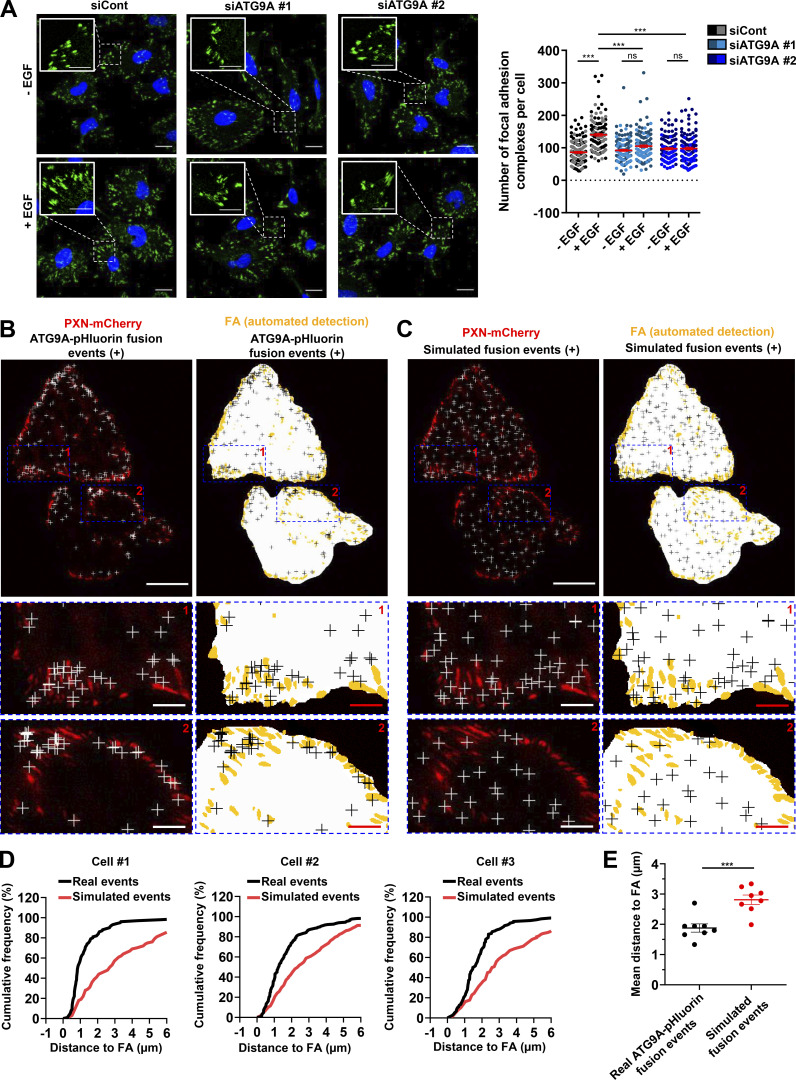
AT9A regulates the formation of adhesion complexes in HeLa cells. (A) Depletion of ATG9A protein inhibits EGF-induced formation of adhesion complexes in HeLa cells. HeLa cells were transfected with nontargeting siRNA (siCont) or one of the two siRNAs targeting ATG9A (siATG9A #1, siATG9A #2). After starvation (1 h) in serum-free medium, cells were treated (1 h) with or without EGF (50 ng/ml), fixed, and labeled with an anti-PXN antibody (green) and nuclei (DAPI labeling, blue). The number of adhesion complexes was quantified for each cell. Data represent means ± SEM (n = 125–131 cells per group; cells from independent experiments were color-coded). Scale bar, 20 µm; inset magnification, 10 µm. Statistical significance was evaluated using one-way ANOVA followed by Sidak post hoc test. ***, P < 0.001. (B–E) ATG9A-positive vesicles target adhesion sites in HeLa cells. HeLa cells expressing PXN-mCherry and ATG9A-pHluorin were recorded using live-cell TIRF microscopy. (B) Left: Distribution of all observed ATG9A-pHluorin fusion events during the recording period (crosses), overlaid on the PXN-mCherry signal (red). Right: Derived synthetic image depicting the ventral cell surface area (white), the PXN-positive adhesion complexes (orange, automated detection using ImageJ), and the ATG9A-pHluorin fusion events (crosses). Note the promiscuity between the adhesion complexes and the fusion events in the magnified view. Scale bar, 20 µm; magnified views, 5 µm. (C) Left: Map of randomly simulated fusion events (crosses), overlaid on the PXN-mCherry signal (red). Right: Derived synthetic image depicting the ventral cell surface area (white), the PXN-positive adhesion complexes (orange) and the simulated fusion events (crosses). Scale bar, 20 µm; magnified views, 5 µm. (D) Cumulative frequency charts, from the cells shown in B (cell #1 and cell #2) and one other representative cell (cell #3), demonstrating the difference in distance to focal adhesions (FA) between real ATG9A-pHluorin fusion events (black line) and simulated events (red line). (E) Quantification of the mean distance to the centroid of closest focal adhesion for real ATG9A-pHluorin events or simulated events (n = 8 cells, for a total number of 1,297 events). Data represent means ± SEM. Statistical significance was evaluated using one-way ANOVA followed by Sidak post hoc test (A) and Mann–Whitney U test (E). ***, P < 0.001.

