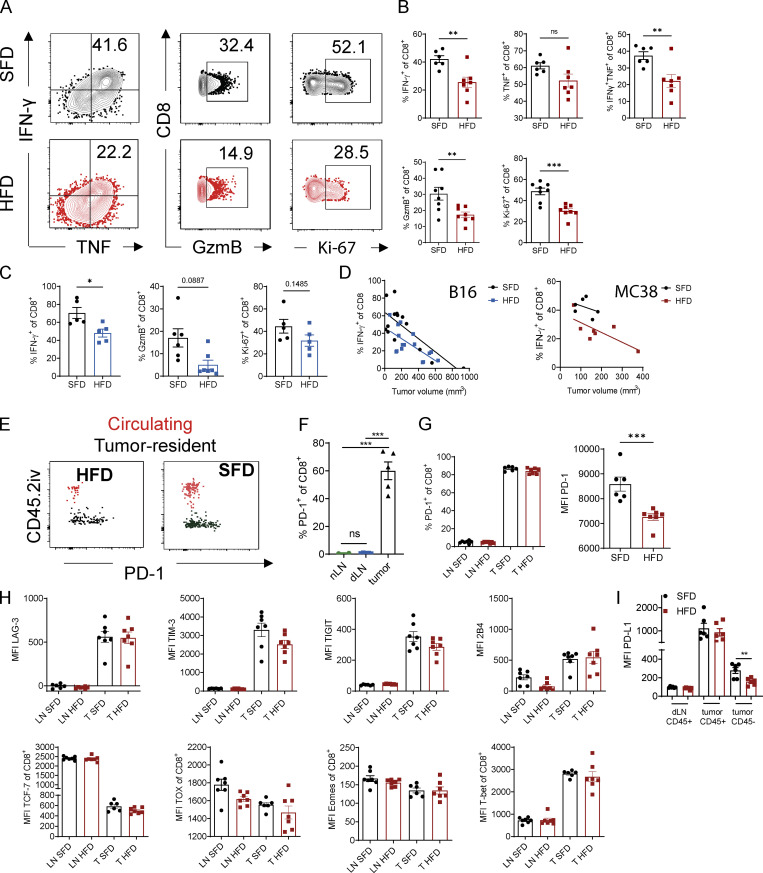
Figure 3.
HFD-induced obesity impairs CD8 T cell effector function in tumors independent of PD-1 expression. (A and B) Flow cytometric analysis of intracellular IFN-γ, TNF, GzmB, and Ki-67 expression by CD8+ T cells in MC38 tumors of SFD-fed (n = 6) and HFD-fed (n = 7) mice. Results are shown as representative FACS plots (A) and percentage of cells (B). (C) Flow cytometric analysis of intracellular IFN-γ, GzmB, and Ki-67 expression by CD8+ T cells in subcutaneous B16-F10 tumors (n = 5 or 6 mice per group). Results are shown as percentage of cells. (D) Correlation between tumor volume and IFN-γ expression in CD8 T cells. Lines represent simple linear regression for each group. Pooled data from three experiments in B16 model (n = 14–16 mice per group) and one representative experiment for MC38 model (n = 6 mice per group). (E) Exemplary FACS plot of PD-1 expression on B16-F10 tumor-resident CD8+ T cells (CD45.2iv−; black) and tumor-circulating CD8 T cells (CD45.2iv+; red). (F) Flow cytometric analysis of PD-1 expression on CD8+ T cells from naive lymph nodes (nLNs), tumor dLNs, and MC38 tumors. (G) Flow cytometric analysis of PD-1 expression on CD8+ T cells from SFD- and HFD-fed mice in dLNs and MC38 tumors. (H) Flow cytometric analysis of surface markers and transcription factors on CD8 T cells from LNs and MC38 tumors. (I) Flow cytometric analysis of PD-L1 expression on CD45+ and CD45− cells in dLNs and MC38 tumors from SFD- and HFD-fed mice. Data are shown as individual mice (dots) and mean ± SEM. (B, C, F, and G) Unpaired Student’s t test. (E) One-way ANOVA. *, P < 0.05; **, P < 0.01; ***, P < 0.001. This experiment was performed three times (B16 model) and at least twice for each graph (MC38 model).

