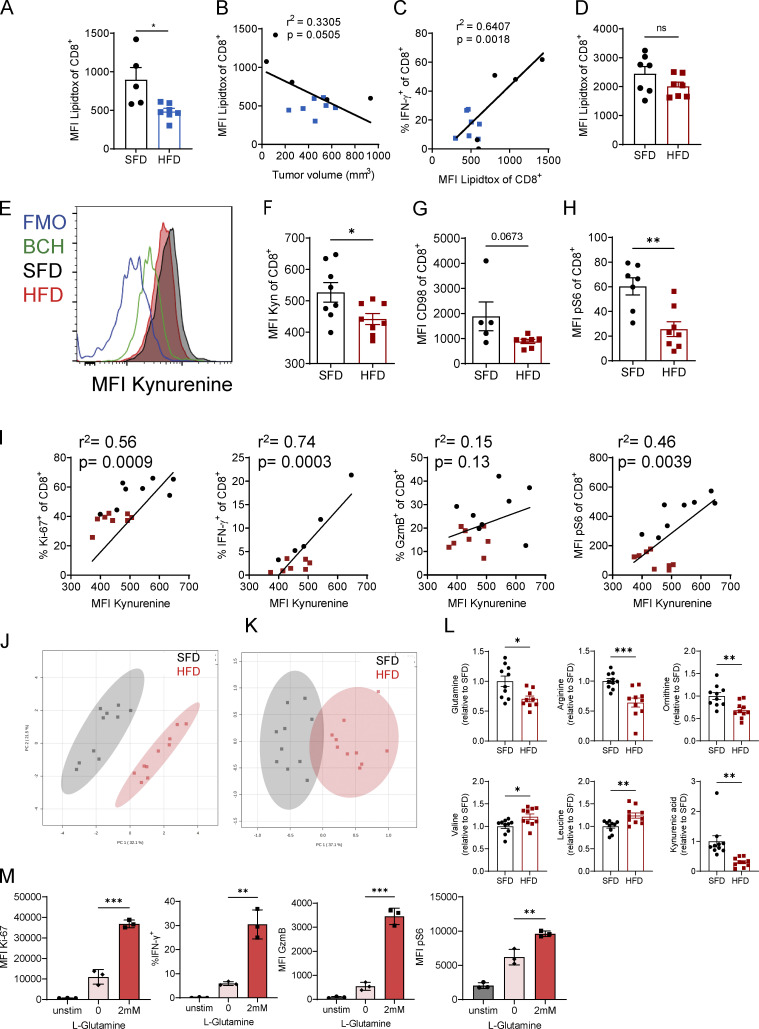
Figure 4.
Obesity-induced functional defects in CD8 T cells are associated with impaired amino acid metabolism. (A–D) C57BL/6 mice were fed an HFD or SFD, and B16-F10 (A–C; n = 5 SFD, n = 7 HFD) and MC38 (D; n = 7 per group) tumors were injected. LipidTOX uptake by CD8+ T cells from tumors was analyzed by flow cytometry. Graphs depict MFI (A and D), correlation of LipidTOX versus tumor volume (B), and correlation of LipidTOX versus IFN-γ expression by CD8+ T cells (C). (E–I) C57BL/6 mice were fed an HFD (n = 8) or SFD (n = 8) for 6 wk, and MC38 tumors were injected s.c. On day 12 after tumor inoculation, tumors were dissected and stained for flow cytometry. (E and F) Representative graph, and quantification of kynurenine uptake by CD8+ T cells in tumors. Cells were treated with the system L blocker BCH or not treated with kynurenine (fluorescence minus one control [FMO]) as negative controls. (G and H) MFI or frequency of kynurenine, CD98, and pS6 in CD8+ T cells. (I) Correlation between kynurenine uptake and expression of intracellular molecules in CD8 T cells. Black dots indicate SFD-fed mice, and red dots indicate HFD-fed mice. (J–L) Serum taken from male SFD-fed (n = 10) or HFD-fed (n = 10) mice was analyzed by mass spectrometry for metabolite composition. Data are represented as fold change over SFD. Pooled data from two experiments. (M) CD8 T cells isolated from naive spleens were activated with anti-CD3/anti-CD28 in the presence or absence of L-glutamine, and expression of Ki-67, IFN-γ, GzmB, and pS6 was analyzed by flow cytometry. Experiment was performed twice (n = 3 technical replicates). (A, D, F–H, and L) Unpaired Student’s t test. (B, C, and I) Simple linear regression. (M) One-way ANOVA. *, P < 0.05; **, P < 0.01; ***, P < 0.001.

