Figure 5.
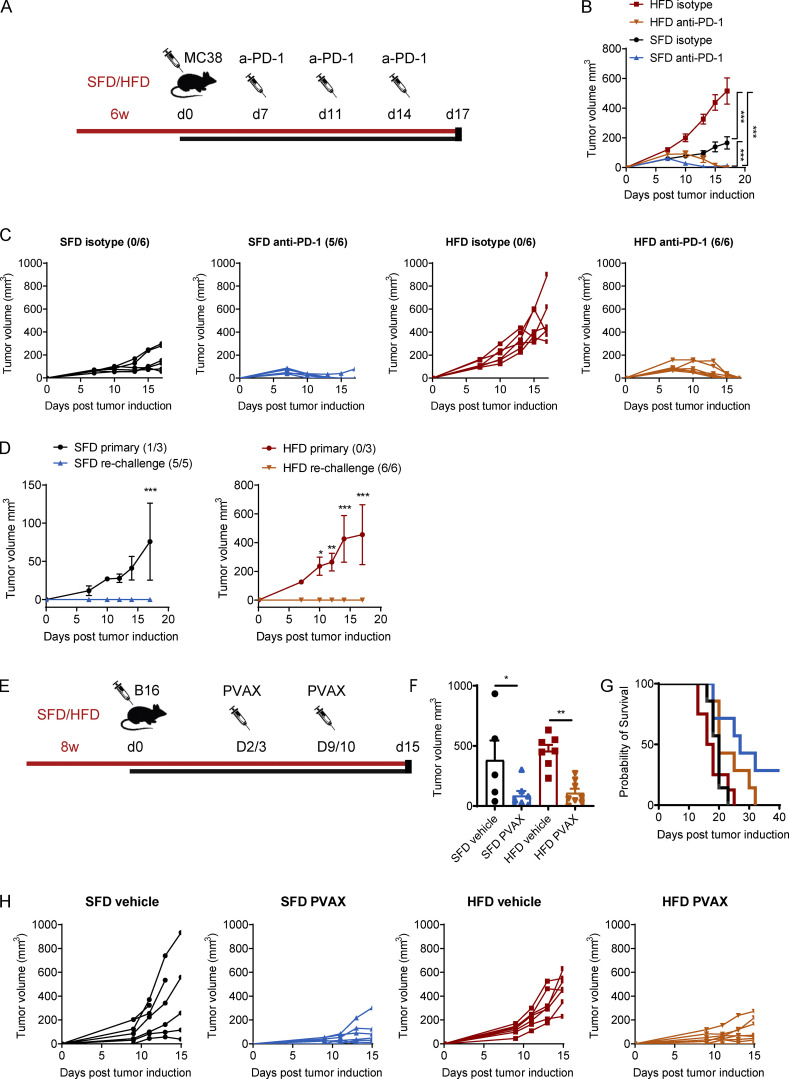
Immunotherapy protects from tumor growth in lean and obese mice. (A–D) C57BL/6 mice were fed an HFD or SFD for 6 wk, and MC38 tumors were injected. On days 7, 11, and 14, mice were injected i.p. with anti–PD-1 (200 µg/mouse). Figure depicts injection scheme (A), mean tumor growth ± SEM, two-way ANOVA (B), and individual tumor growth curves (C). (D) Mice that previously rejected tumors were rechallenged with MC38 tumor cells and compared with SFD- or HFD-fed mice that had not been injected with tumor cells previously (primary). Graphs depict mean tumor growth ± SEM (two-way ANOVA). Numbers in brackets indicate the number of mice that rejected the tumor out of the total mice in the group (n = 6 per group; experiment was performed four times). (E–H) C57BL/6 mice were fed an HFD or SFD for 8 wk, and B16-F10 tumors were injected. On days 2 and 9, mice were injected i.p. with anti–PD-1 (200 µg/mouse), and, on days 3 and 10, mice were injected s.c. with a vaccine (hs/irr B16-F10 + R848) peritumorally. Experiment was performed twice (n = 7 or 8 per group). Figure depicts injection scheme (E); mean tumor volume ± SEM on day 15; dots represent individual mice; one-way ANOVA (F); percentage survival (i.e., mouse reached experimental endpoint; G); and individual tumor growth curves (H). *, P < 0.05; **, P < 0.01; ***, P < 0.001.

