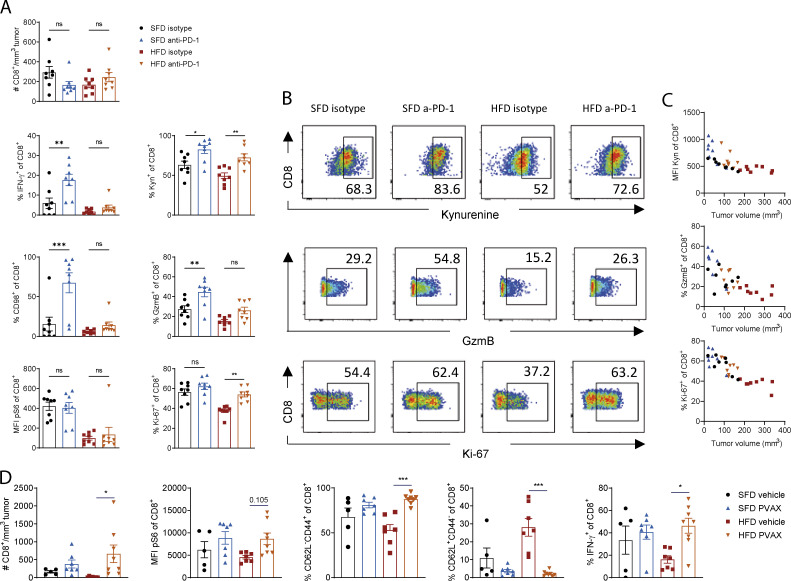
Figure 6.
Immunotherapy partially restores CD8 T cell function in lean and obese mice. (A–C) C57BL/6 mice were fed an HFD or SFD for 6 wk, and MC38 tumors were injected as in Fig. 5 A. On day 10, mice were injected i.p. with anti–PD-1 (200 µg/mouse), and tumors were analyzed on day 12. Data are shown as individual mice (dots; n = 7 or 8 per group) and mean ± SEM (A), representative FACS plots (B), and correlation between tumor size and kynurenine, Ki-67, or GzmB expression (C). Experiment was performed three times. (D) C57BL/6 mice were fed an HFD or SFD for 8 wk, and B16-F10 tumors were injected as in Fig. 5 E. On days 2 and 9, mice were injected i.p. with anti–PD-1 (200 µg/mouse), and, on days 3 and 10, mice were injected s.c. with a vaccine (hs/irr B16-F10 + R848) peritumorally. On day 15, tumors were analyzed by flow cytometry. Figure depicts flow cytometric analysis of CD8+ T cells in the tumors. Data are shown as individual mice (dots; n = 5–7 per group) and mean ± SEM. Experiment was performed twice. Significance was calculated using one-way ANOVA. *, P < 0.05; **, P < 0.01; ***, P < 0.001.

