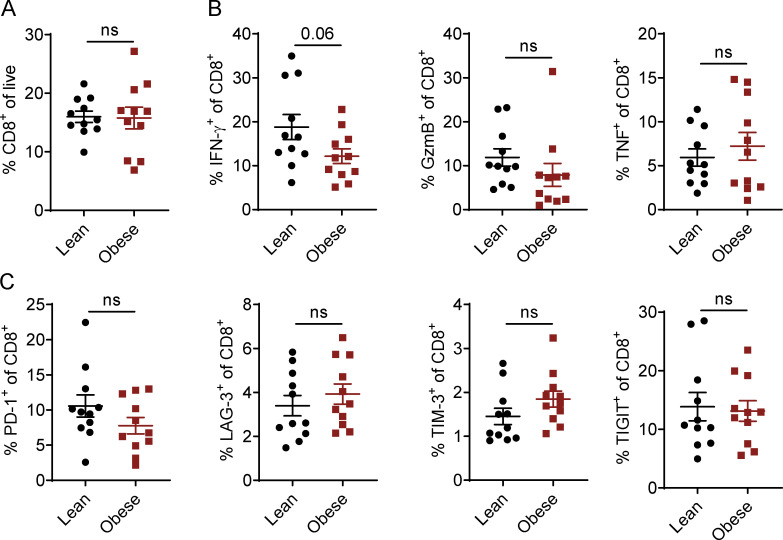
Figure S3.
Activation profile of human CD8 T cells from lean and obese donors. (A–C) Flow cytometric analysis of CD8+ T cells in PBMCs of lean (n = 11) or obese (n = 11) donors. PBMCs were either stained directly (A and C) or stimulated with PMA, ionomycin, and BFA for 3.5 h before staining (B). Data are shown as individual donors and mean ± SEM; unpaired Student’s t test.

