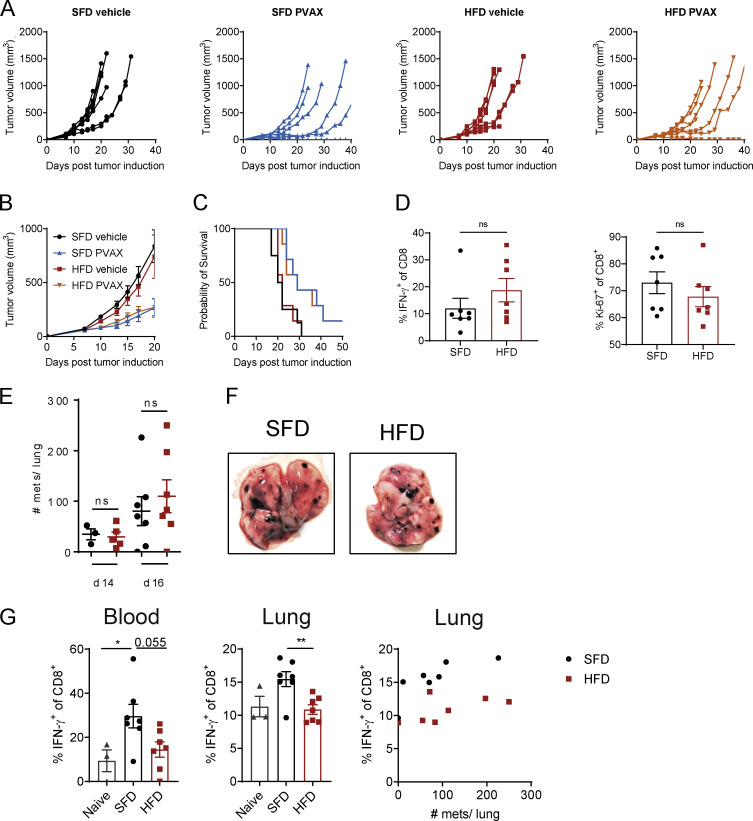
Figure S4.
Effect of HFD-induced obesity in the B16-F10 metastatic model. (A–C) BALB/c mice were fed an SFD or HFD for 8 wk, and mice were injected s.c. with CT26 tumor cells (n = 7 or 8 mice per group; experiment was performed twice). On days 2 and 9, mice were injected i.p. with anti–PD-1 (200 µg/mouse), and, on days 3 and 10, mice were injected s.c. with a vaccine (hs/irr CT26 + R848) peritumorally. Figure depicts mean tumor growth ± SEM (A), percentage survival (i.e., mouse reached experimental endpoint; B), and individual tumor growth curves (C). (D) Tumor-infiltrating CD8 T cells were analyzed by flow cytometry. (E–G) C57BL/6 mice were fed an HFD or SFD for 8 wk, and mice were injected i.v. with B16-F10 tumor cells (combined data from two experiments; n = 3–7 per group). Graph shows number of lung metastases (mets) on days 14 and 16 after tumor injection (A) and exemplary images of lungs from SFD- and HFD-fed mice (B). (C) Flow cytometric analysis of IFN-γ expression by CD8+ T cells in the blood and lungs of non–tumor-bearing (naive) or SFD- or HFD-fed tumor-bearing mice. Data are shown as individual mice and mean ± SEM; unpaired Student’s t test (E and D) and one-way ANOVA (C). *, P < 0.05; **, P < 0.01.

