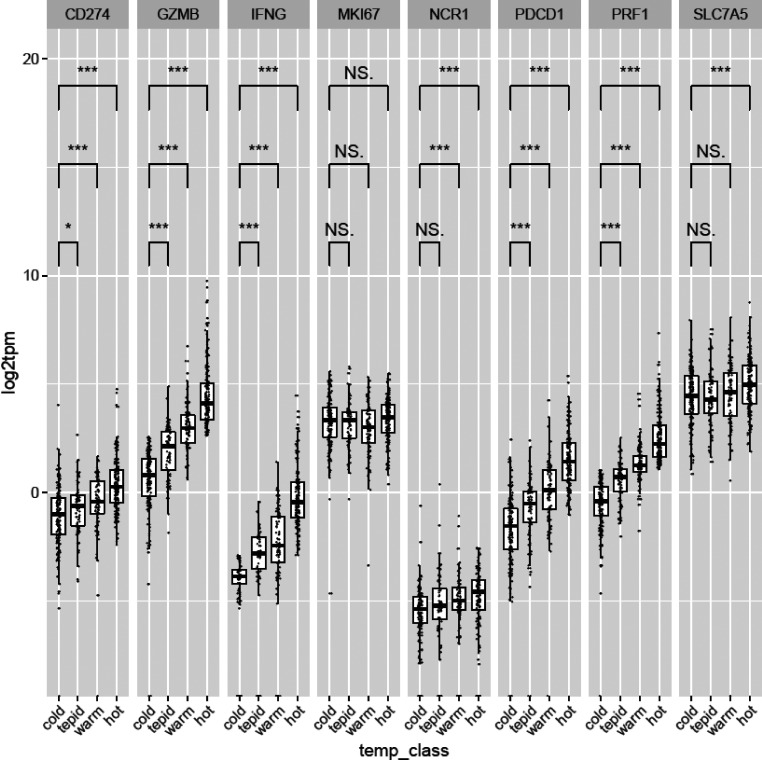
Figure S5.
Genes associated with tumor temperature classes. Correlation of genes with tumor temperature classes. Patient samples were scored by their median expression value for IFN-γ, GzmB, and PRF1 (+0 for below median, +1 for above median). Scores were summed to give four temperature classes (0–3), named as “cold,” “tepid,” “warm,” and “hot,” respectively. Wilcoxon rank-sum tests were used to determine if the distribution of genes of interest was significantly different between each temperature class. *, P < 0.05; ***, P < 0.001.

