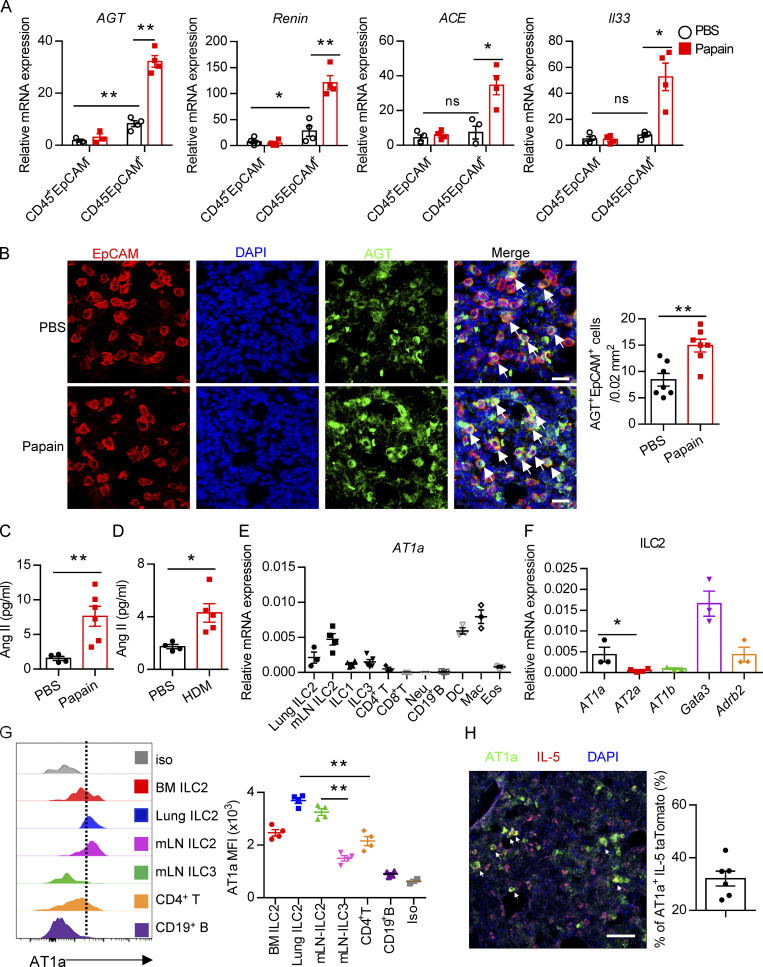
Figure 1.
Evaluation of Ang II–AT1a signaling in epithelial cells and ILC2s from lung. (A and B) Naive mice were i.n. administered with papain (20 µg/mouse/d) or PBS for 5 d and sacrificed on day 6. (A) mRNA expression of AGT, Renin, and ACE was measured in lymphocytes (CD45+EpCAM−) and epithelial cells (CD45−EpCAM+) from lungs. Il33 was used as a positive control. (B) IF staining of AGT in the tracheal epithelium from naive mice after papain or PBS challenge (n = 3 or 4). Representative images are shown, with statistical data from three independent experiments. Red, EpCAM; green, AGT; blue, DAPI; scale bar, 20 µm. (C and D) The levels of Ang II in the BALF after papain (C) or HDM (D) challenge; PBS was used as a vehicle control. PBS, n = 4; Papain, n = 6; HDM, n = 5. (E) AT1a expression was measured by qRT-PCR. Mac, macrophages; Neu, neutrophils; DC, dendritic cells; Eos, eosinophils; n = 3 or 4. (F) Expression of distinct Ang II receptors in ILC2s from lung. (G) Flow-cytometric analyses of AT1a expression in distinct ILC subsets; n = 4. (H) IF staining of AT1a in lungs from IL-5–tdTomato–reporter mice under steady-state; tdTomato-positive cells indicate ILC2s; scale bar, 50 µm; n = 3. All data are from two or three independent experiments in all graphical panels; mean ± SEMs are shown in all graphical panels. Two-way ANOVA (A) or the unpaired t test (B–G) was used. *, P < 0.05; **, P < 0.01. BM, bone marrow; iso, isotype; MFI, mean fluorescence intensity.

