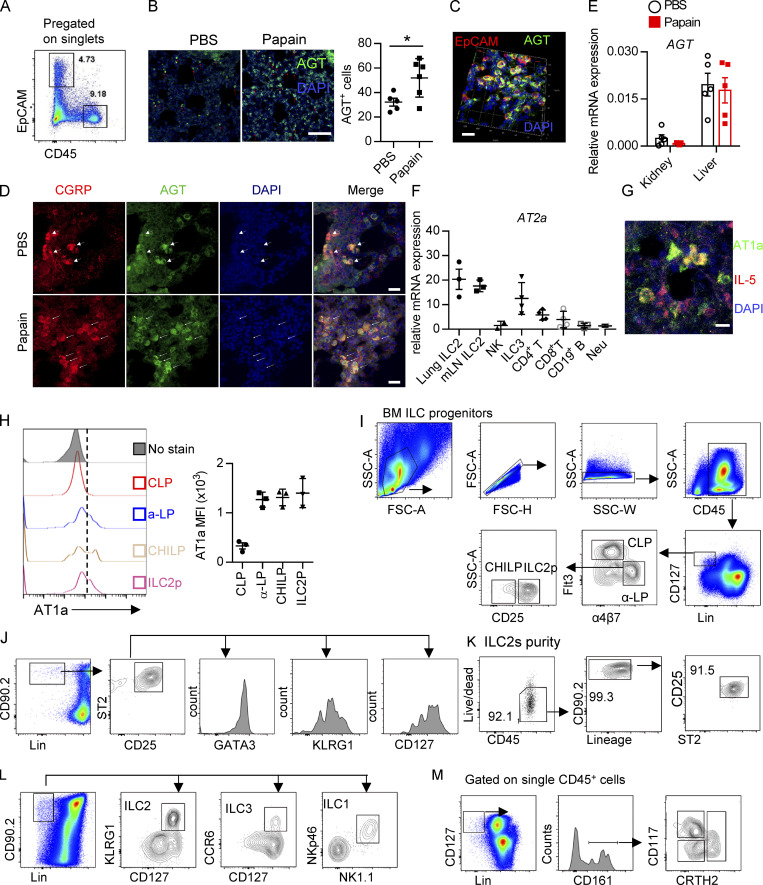
Figure S1.
Expression of Ang II receptors and gating strategies of distinct cells. (A) Gating strategies of lung EpCAM+ cells and CD45+ immune cells. (B) AGT expression in the homeostasis and papain challenge representative images are from three independent experiments. Scale bars, 100 µm; n = 3/group. (C) Representative three-dimensional images of EpCAM and AGT captured by LSM780. (D) IF staining of AGT, CGRP, and DAPI in lung tissues from naive mice after papain or PBS challenge. Representative images are shown: red, CGRP; green, AGT; blue, DAPI; scale bar, 20 µm. Representative images are two repeated independent experiments; n = 3/group. (E) The AGT mRNA expression in the tissue of liver and kidney tissues during the steady and papain challenge (n = 5). (F) AT2a expression in different immune cells. (G) Representative images of AT1a- and IL-5–positive cells; scale bars, 20 µm. (H) The mean fluorescence intensity (MFI) of AT1a in the bone marrow (BM) precursors CLP, α-lymphoid progenitor (α-LP), common helper-like ILC progenitor (CHILP), and ILC2 precursor. (I–M) The gating strategies of flow cytometry are shown, including bone marrow ILC progenitors (I), lung ILC2s (J), purity test of lung ILC2 (K), mLN ILC subsets (L), including ILC1s, ILC2s, ILC3s, and human peripheral blood ILC1s, ILC2s, and ILCp (M). FSC, forward scatter area; Neu, neutrophil; SSC, side scatter.

