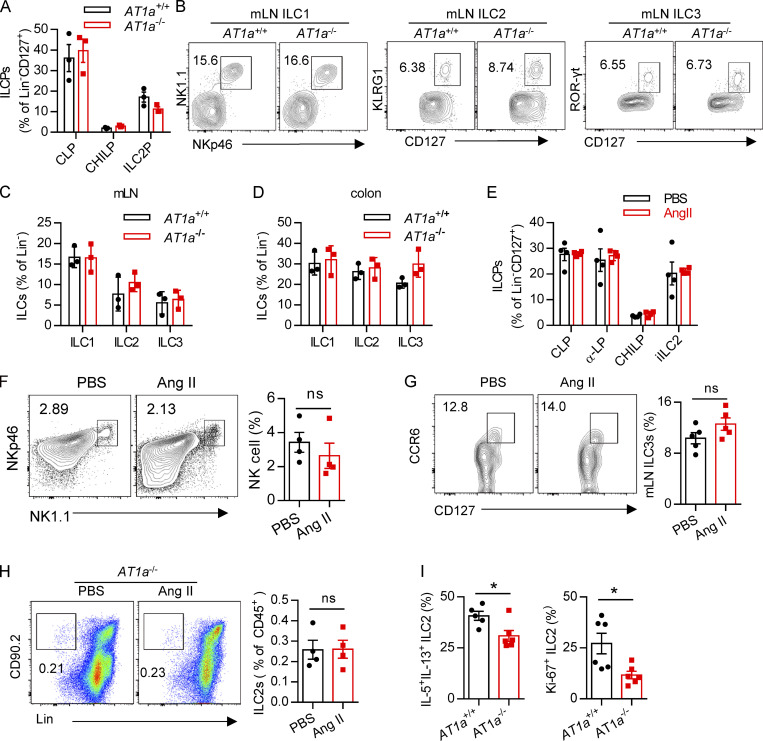
Figure S2.
Immune response of AT1a-deficient mice or Ang II treatment. Related to Fig. 2. (A) Bone marrow ILC progenitors in AT1a−/− and WT (AT1a+/+) littermate controls under steady-state. (B) Representative flow plots of mLN ILC1s, ILC2s, and ILC3s in AT1a−/− and AT1a+/+ controls. (C and D) Abundance of mLN (C) and colon (D) ILC1s, ILC2s, and ILC3s in AT1a−/− and AT1a+/+ controls. Data are from two independent experiments; n = 3/group. (E–G) WT mice were i.p. administered Ang II or PBS daily for 5 d. 24 h later, flow cytometry was used to analyze bone marrow, lung, and mLN. (E) Abundance of ILC progenitors in bone marrow was determined after Ang II and PBS treatment. (F and G) Spleen NK cells and mLN ILC3s were measured by flow cytometry. (H) AT1a−/− mice were i.p. injected with Ang II daily for 5 consecutive days. Lung ILC2s were analyzed by flow cytometry. (I) Intracellular cytokine production of IL-5 and IL-13 by ILC2s and ILC2 proliferation were determined by flow cytometry in AT1a−/− and AT1a+/+ mice after treatment with Ang II for 5 consecutive days. Representative data are from two or three repeated independent experiments; n = 4 or 5/group. Graphical data show mean ± SEM by two-way ANOVA (A and C–E) and unpaired t test (F–I). *, P < 0.05. Lin, lineage; ROR, retinoic acid–related orphan receptor.

