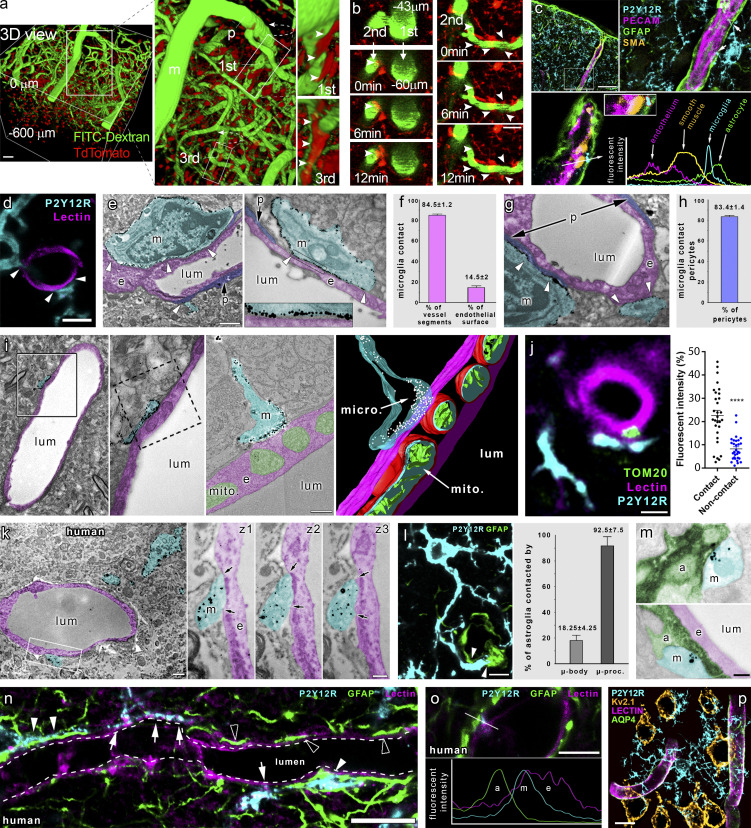
Figure 1.
Microglia form direct purinergic contact with cells in the NVU that regulate CBF. (a) 3D reconstruction of in vivo two-photon Z-stacks down to 600 μm below the dura mater in the cerebral cortex of CX3CR1tdTomato mice. Note contacting microglia (arrowheads) at meningeal (m), penetrating (p), and first- to third-order capillaries. Scale bar, 50 μm. (b) Microglial processes (arrowheads) dynamically contact different segments of the vascular tree (visualized by i.v. FITC-dextran). Scale bar, 20 µm. (c) Microglial processes are extended beyond the perivascular glial endfeet and form direct contact with smooth muscle cells (arrows) at the level of penetrating arteries. (d) CLSM images show microglia (P2Y12R, cyan) contacting endothelial cells (tomato lectin, magenta) in the cerebral cortex. (e) EM images show microglia (m, P2Y12R-immunogold labeling, cyan) directly contacting endothelial cells (e, magenta) and pericytes (p, purple). (f) Frequency of vessels receiving microglial contact, and microglial process coverage of endothelial cell surface. (g) EM images show microglia (m, P2Y12R-immunogold labeling, cyan) directly contacting pericytes (p, purple). (h) 83.4 ± 1.4% of pericytic cell bodies are contacted by microglial processes. (i) 3D reconstruction of electron tomogram shows clustering of anti-P2Y12R-immunogold on microglial processes (m) directly contacting the endothelium (e) of an arteriole/postcapillary venule. The left two panels are conventional EM images of the same area on the adjacent ultrathin section. The right panels show a tomographic virtual section and 3D reconstruction of the direct contact. (j) Unbiased anatomic analysis reveals enrichment of endothelial mitochondria (TOM20+, green), at sites of microglial contacts (P2Y12R+, cyan). ****, P < 0.0001, Mann–Whitney U test. See analysis details in Fig. S1 d. (k) EM images show microglia (m, P2Y12R-immunogold, cyan) directly contacting endothelial cells (e, magenta) in human neocortex. z1–z3 panels show the contact on three consecutive ultrathin sections; arrows mark the edges of direct membrane contact. (l) CLSM image shows microglia (P2Y12R, cyan) contacting the cell body of an astrocyte (GFAP labeling, green) and astrocytic endfeet (arrowheads). (m) EM images show direct contact between microglial (m, cyan) and astrocytic (a, green) processes. e, endothelial cell, magenta; lum, lumen. (n) CLSM images in human neocortex reveal P2Y12R+ microglial processes (cyan) contacting perivascular astrocytes (GFAP, green) on astrocyte endfeet (white arrowheads) and endothelial cells (tomato-lectin, magenta, white arrows), with astrocytic endfeet directly touching the endothelial monolayer (empty arrowheads). (o) CLSM image and fluorescent intensity plots show microglial process (m) contacting the endothelial layer (e) within the astrocytic layer (a). (p) To reveal 3D connections of individual microglial cells, a CLSM maximum-intensity plot was generated. Microglia (cyan) contact several microvessels (lectin, magenta; AQP4, green) and neurons (Kv2.1, ochre) simultaneously. For appropriate visualization of neuronal cell bodies, Kv2.1 is shown in yellow pseudocolor only with the maximal diameter planes included. Scale bars: (c) 50 µm; (d) 3 µm; (e) 2 µm; (i) 200 nm; (j) 2 µm; (k) left, 1 μm, and z3, 400 nm; (l) 10 µm; (m) 200 nm; (n) 10 µm; (o) 5 µm; (p) 10 µm.

