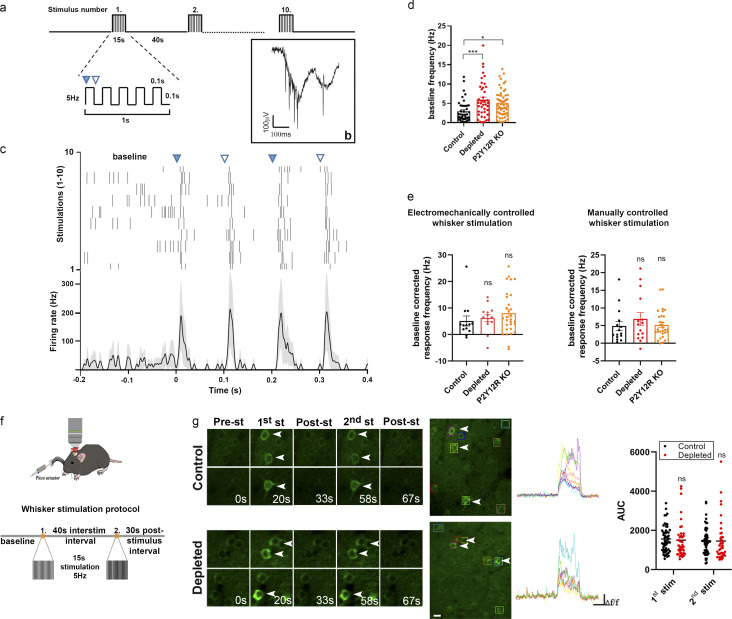
Figure 3.
Whisker stimulation–evoked neuronal responses in the barrel cortex do not explain altered CBF responses after microglia manipulation. (a) Schematics of the whisker stimulation protocol. Whiskers were stimulated electromechanically with 5 Hz, causing alternating passive deflections of the vibrissae in the anterior and posterior directions (filled and empty arrowheads, respectively) for 15 s, followed by a 40-s pause, repeated 10 times. (b) Raw tetrode data showing extracellular spikes recorded from the barrel cortex. (c) Example of a single neuron activated by passive whisker deflections. Top, raster plot aligned to whisker stimulation onset (black ticks, individual action potentials). Bottom, peristimulus time histogram showing mean firing responses of the same neuron (shading, SEM). (d) Baseline firing rates were significantly higher in depleted and P2Y12R KO mice compared with controls. n = 4 control, n = 3 depleted, and n = 5 P2Y12R KO mice; P = 0.001, one-way ANOVA with Dunnett’s multiple comparisons test (***, P < 0.006, control versus depleted; *, P = 0.0109, control versus P2Y12R KO). (e) Stimulus-induced firing rate changes were comparable across controls and microglia-depleted mice using either electromechanically or manually controlled whisker stimulation. Data are presented as baseline corrected response frequency (for corresponding baseline frequencies, mean ± SEM); n = 4 control, n = 3 depleted, and n = 5 P2Y12R KO mice; P = 0.2087 and P = 0.6391, Kruskal–Wallis test with Dunn’s multiple comparisons test. (f) Schematic outlines of the whisker stimulation protocol used for in vivo two-photon [Ca2+]i imaging in the barrel cortex of Thy1-GCaMP6s mice. interstim, interstimulation. (g) Representative images show stimulus-evoked neuronal [Ca2+]i responses with individual traces of neurons labeled with rectangles during baseline imaging and 15-s stimulation and after stimulation. AUC values of neuronal GCaMP6s signal changes in response to the first and second electromechanically controlled whisker stimulation in control and microglia-depleted mice. n = 4 mice per group, n = 56 neurons from control and n = 40 neurons from depleted mice from two trials; P = 0.765, two-way ANOVA with Sidak’s multiple comparisons test. Scale bar, 20 µm. st and stim, stimulation. Data are presented as mean ± SEM.

