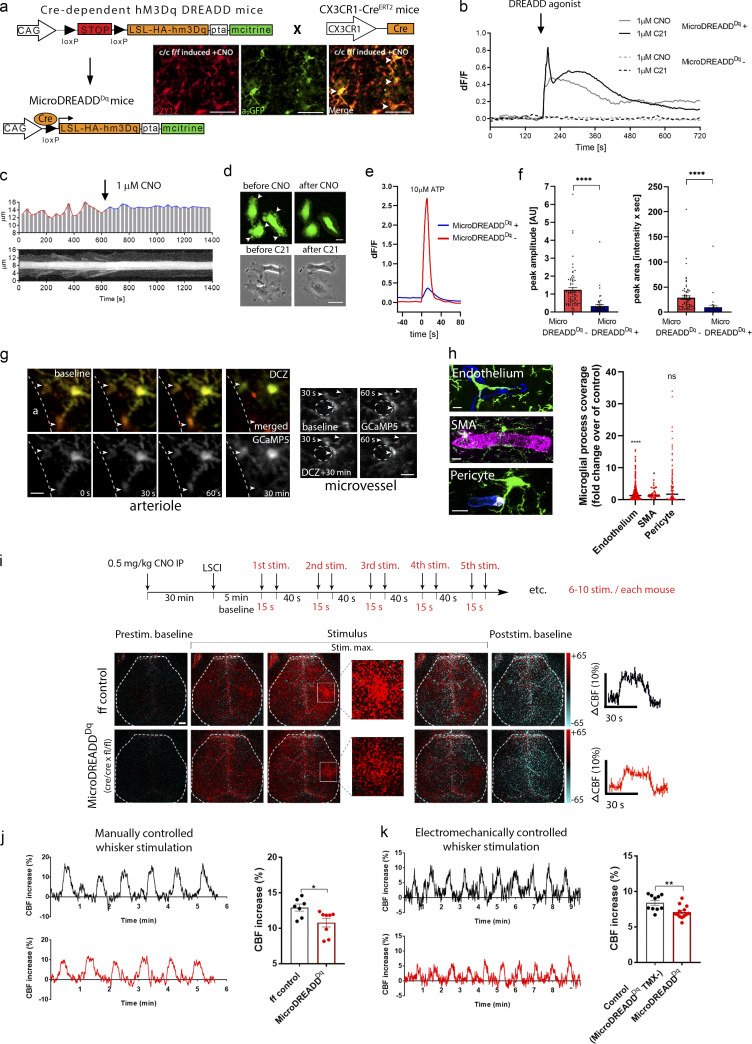
Figure 4.
Chemogenetic modulation of microglial activity leads to decreased process motility and impaired neurovascular coupling response to whisker stimulation. (a) Generation of a novel chemogenetic mouse model. TMX-induced recombination was confirmed by anti-P2Y12R and anti-GFP (mCitrine) double staining (white arrowheads), allowing chemogenetic activation of microglia by CNO. Scale bar, 50 μm. (b) Representative ∆F/F calcium traces of MicroDREADDDq microglia cells responding to DREADD agonists CNO or C21. (c and d) The kymogram (c) and fluorescent/phase contrast images (d) taken from time-lapse sequences show that cell membrane ruffling is ceased upon treatment with DREADD agonists, and the cells acquire a flattened morphology. Scale bars, 5 μm, upper panel; 10 μm, lower panel. See also Video 4 and Video 5. (e and f) Analyses of calcium curves reveal an attenuated responsiveness to ATP in MicroDREADDDq+ cells previously responding to C21. See details in Fig. S2. n = 64 for MicroDREADDDq+, n = 73 for MicroDREADDDq−; ****, P < 0.0001, Mann–Whitney U test (f). (g) Microglial processes interacting with blood vessels show dynamic [Ca2+]i fluctuations (arrowheads) in the cerebral cortex of MicroDREADDDq × CGaMP5g–tdTomato mice in vivo. Microglial responses have been investigated before (baseline) and 30 min after administration of the DREADD agonist deschloroclozapine (DCZ) around arterioles (a, lumen of the arteriole is shown) and microvessels (n = 4 mice). Scale bar, 10 µm. (h) 1 h after chemogenetic activation, microglial process coverage (Iba1, green) of endothelial cells (lectin, blue), smooth muscle cells (SMA, magenta), and pericytes (PDGFRb, white) was assessed on perfusion fixed brain sections. Scale bar, 10 µm. n = 263 blood vessels, n = 66 SMA-positive vessels, and n = 291 pericytes were measured from n = 3 mice; ****, P = 0.0001 endothelium versus control and *, P = 0.026 SMA versus control, Mann–Whitney U test. (i) 6 wk after TMX, CBF was measured by LSCI during whisker stimulations in MicroDREADDDq and control mice 30 min after a single i.p. (IP) CNO administration. Representative difference images show CBF changes relative to baseline in control and MicroDREADDDq mice (white rectangle indicates the area of barrel cortex). Representative stimulus-evoked response curves are shown in the right of i. Scale bar, 1 mm. (j and k) Representative CBF curves of manually and electromechanically controlled whisker stimulation measured by LSCI. The maximum of evoked responses show a marked reduction in MicroDREADDDq mice compared with controls. n = 7 control and n = 8 MicroDREADDDq mice; *, P = 0.0401, Mann–Whitney U test (j); n = 10 control and n = 13 MicroDREADDDq mice; **, P = 0.0045, unpaired t test (k). Data are presented as mean ± SEM. LSCI data have been pooled from two to three independent experiments.

