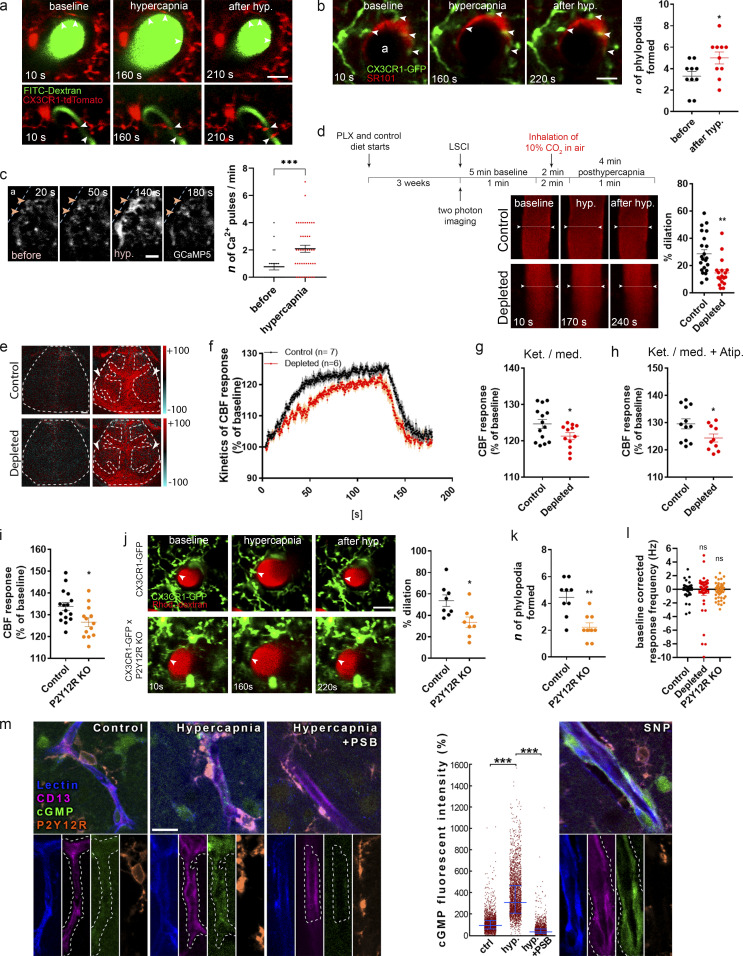
Figure 5.
Microglia contribute to hypercapnia-induced vasodilation. (a) In vivo two-photon resonant (32-Hz) imaging was performed in the somatosensory cortex of CX3CR1tdTomato mice during hypercapnia (by inhalation of 10% CO2 under normoxic conditions). The middle panel shows the maximal vasodilation provoked by hypercapnia. Scale bar, 20 μm. (b) Identical hypercapnic challenge and imaging protocol was performed in CX3CR1GFP/+ mice after intracortical injection of SR101 to visualize astrocytes. The number of phylopodia formed at the end of contacting microglial processes (arrowheads) increased in response to hypercapnia. n = 5 mice; *, P = 0.0316, Mann–Whitney U test. Scale bar, 20 µm. (c) Perivascular microglia respond rapidly to hypercapnia with [Ca2+]i pulses in small (arrowheads) and large processes as assessed in CX3CR1CGaMP5g–tdTomato mice. Individual processes were followed with in vivo two-photon resonant (31-Hz) imaging; see also Video 7. Scale bar, 10 µm. n = 4 mice; ***, P = 0.001, Mann–Whitney U test. (d) In vivo two-photon imaging reveals impaired vasodilation at the level of penetrating arteries in the absence of microglia. n = 22 and n = 18 vessels from eight control and six depleted mice; **, P = 0.0013, unpaired t test. The experimental protocol shown for hypercapnic (hyp.) challenge was identical for in vivo two-photon imaging (a–d and j–l) and LSCI (e–i). (e) Difference images show reduced CBF response in microglia-depleted mice to hypercapnic challenge (ROIs are labeled with arrowheads). Scale bar, 1 mm. (f) The average kinetics of hypercapnic responses show difference in depleted mice compared with controls. n = 14–12 ROIs from seven control and six depleted mice, two ROIs/mouse (f and g); ****, P < 0.0001, Mann–Whitney U test (f); *, P = 0.0472, unpaired t test (g). (g and h) Hypercapnia-evoked CBF response is markedly decreased in the absence of microglia under ketamine-medetomidine (Ket./med.; g) or Ket./med. (h) anesthesia after administration of atipamezole (Atip.). n = 12–10 ROIs from six control and five depleted mice, two ROIs/mouse; *, P = 0.0436, unpaired t test. (i) Hypercapnia-evoked CBF response is markedly decreased in P2Y12R KO mice as assessed by LSCI. n = 16 control, n = 13 P2Y12R KO; *, P = 0.0131, unpaired t test. (j) In vivo two-photon imaging reveals that elimination of P2Y12R impairs hypercapnia-induced vasodilation in double transgenic (CX3CR1GFP/+ × P2Y12R KO) mice compared with P2Y12R-competent CX3CR1GFP/+ mice. n = 8 and 8 vessels from n = 5 control and n = 5 P2Y12R KO mice; *, P = 0.0104, Mann–Whitney U test. Scale bar, 20 µm. (k) The number of phylopodia formed at the end of perivascular microglial processes in response to hypercapnia is significantly reduced in P2Y12R KO mice. n = 5 control and n = 5 P2Y12R KO mice; **, P = 0.003, Mann–Whitney U test. (l) During hypercapnic challenge, neuronal activity did not differ between control, microglia-depleted, and P2Y12R KO mice. n = 49 single units in control, n = 44 in depleted, and n = 61 in P2Y12R KO group; P = 0.4852, Kruskal–Wallis test with Dunn’s multiple comparison. (m) Single image planes for CLSM imaging show small blood vessel segments from the second to third layer of the neocortex in acute brain slices. Lectin (blue) outlines the vessels, CD13 labels contractile elements (pericytes and smooth muscle cells), microglial P2Y12R is orange, and cGMP signal can be seen in green. cGMP levels were measured within areas (outlined by white dashed line) masked based on CD13 staining. A low level of basal cGMP levels can be seen under control conditions, while hypercapnia induced a robust increase in vascular cGMP levels. Preincubation with the P2Y12R inhibitor PSB0739 abolished hypercapnia-induced cGMP elevation. As a control, application of the NO donor SNP also induced robust cGMP production. Scale bar is uniformly 15 µm. n = 3 mice; ***, P < 0.0001, Kruskal–Wallis test. Data are expressed as mean ± SEM (b–d and f–l) and median ± IQR (m). LSCI data have been pooled from two to three independent experiments.

