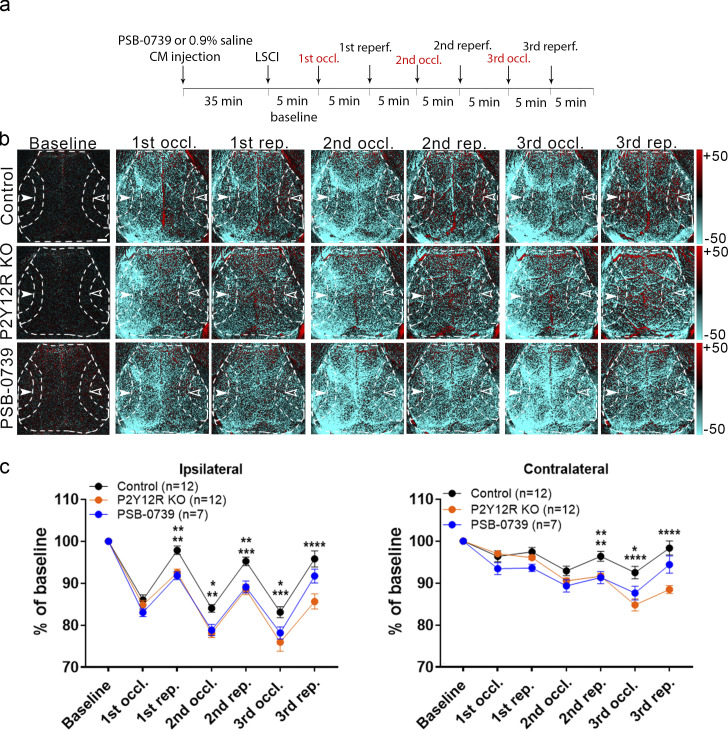
Figure 8.
Microglial actions on CBF require P2Y12R signaling. (a) Outline of the experimental 3× CCAo protocol (occl., occlusion; reperf., reperfusion). (b) Representative difference images show altered perfusion in both hemispheres in response to 3× CCAo in P2Y12R KO and PSB0739-injected mice compared with controls. Dashed lines show the MCA2 area both in the ipsilateral (white arrowheads) and in the contralateral hemisphere (empty arrowheads) corresponding to the quantitative analysis shown in c. Scale bar, 1 mm. rep., reperfusion. (c) A significant impairment in adaptation to hypoperfusion is seen both in the ipsilateral and contralateral hemispheres of P2Y12R KO mice and PSB0739-injected mice compared with controls. n = 12 control, n = 12 P2Y12R KO, n = 7 PSB0739-injected mice; ****, P < 0.0001, two-way ANOVA followed by Tukey’s multiple comparison test (ipsilateral first rep., **, P = 0.0042 control versus P2Y12R KO; **, P = 0.0057 control versus PSB-0739; second occl., **, P = 0.0013 control versus P2Y12R KO; *, P = 0.0214 control versus PSB-0739; second rep., ***, P = 0.0002 control versus P2Y12R KO; **, P = 0.0049 control versus PSB-0739; third occl., ***, P = 0.0001 control versus P2Y12R KO; *, P = 0.0302 control versus PSB-0739; third rep., ****, P < 0.0001 control versus P2Y12R KO; contralateral second rep., **, P = 0.004 control versus P2Y12R KO; **, P = 0.0096 control versus PSB-0739; third occl., ****, P < 0.0001 control versus P2Y12R KO; *, P = 0.0133 control versus PSB-0739; third rep., ****, P < 0.0001 control versus P2Y12R KO). Data are expressed as mean ± SEM. LSCI data have been pooled from two to three independent experiments.

