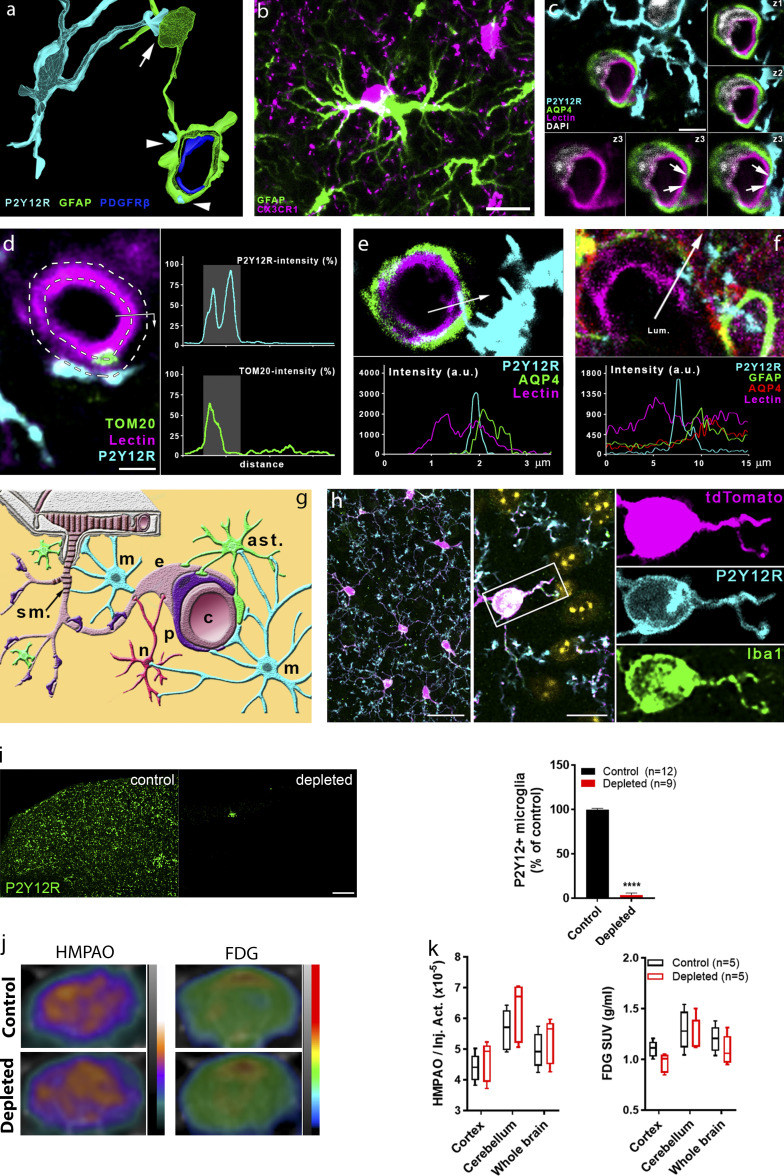
Figure S1.
Microglia form direct contacts with cells in the NVU, but microglia depletion does not disrupt cerebal perfusion or metabolism. (a) 3D reconstruction of a high-resolution CLSM Z-stack shows microglia (P2Y12R, cyan) contacting both the cell body of an astrocyte (GFAP labeling, green, arrow) and astrocytic endfeet (arrowheads) ensheathing a capillary. Pericytes are visualized by anti-PDGFRb labeling (blue). (b) Microglia (CX3CR1, magenta) are able to form direct contact by their cell body with astrocytes (GFAP labeling, green) in the cerebral cortex. Scale bar, 10 μm. (c) CLSM image shows P2Y12R-positive microglial process (cyan) contacting perivascular AQP4-positive astrocyte endfeet (green) and also extends to the endothelial layer (lectin, magenta) where astrocytic coverage is not present (arrows). z1–z3 panels show the contact area on three consecutive confocal sections. Scale bar, 3 μm. (d) The process of semiautomated unbiased analysis of fluorescent intensity area for the graph presented in Fig. 1 j is depicted. White dashed lines represent the outer and the inner profiles, based on the outline of the endothelial cell. P2Y12R intensity was measured along the outer profile and TOM20 intensity along the inner profile, starting from the arrow. The intensity values are plotted (right) along the perimeter of the vessel. Contact site (marked by the gray column in the plots) was defined automatically. Scale bar, 2 µm. (e) CLSM image and fluorescent intensity plots show microglial process extending beyond perivascular astrocytic endfeet to interact with the endothelium. The fluorescent intensity profile plot (measured along the 3.5-µm long white arrow) clearly shows the presence of the microglial process under the astrocytic endfeet. (f) CLSM image and fluorescent intensity plots show microglial processes interacting with GFAP- and AQP4-positive astrocytes in the human brain. The fluorescent intensity profile plot (measured along the 15-μm-long white arrow) clearly shows the presence of the microglial process between the endothelium and the endfeet of perivascular astrocytes. (g) Schematic summary of contacts formed between microglia (m; cyan) and different cell types of the NVU. Neurons (n; red), astrocytes (ast.; green), pericytes (p; purple), endothelial cells (e; pale crimson), and vascular smooth muscle cells (s.m.; dark crimson) are shown. (h) Characterisation of CX3CR1tdTomato mice. Parenchymal tdTomato-positive cells coexpress Iba1 and P2Y12R in the cerebral cortex. Cell nuclei stained with DAPI appear in yellow pseudocolor in the merged middle image. Scale bars, 25 µm (left), 10 µm (middle). (i) Feeding C57BL/6J mice with a diet containing PLX5622 results in an almost complete (97%) elimination of resident microglia as evidenced by the numbers of P2Y12R-positive cells in the cerebral cortex. Scale bar, 100 μm. n = 12 control and n = 9 depleted mice per group; ****, P < 0.0001 control versus depleted, unpaired t test with Welch’s correction. (j and k) HMPAO-SPECT and FDG-PET images of control and microglia-depleted mice. Proportion of measured and injected HMPAO activity (Inj. Act.) and standard uptake values (SUVs) of FDG are shown. Atlas-based ROI analysis (j) shows no significant differences between the normalized regional uptake values (k) of the two groups. n = 5 and 5 mice. Data are expressed as mean ± SEM.

