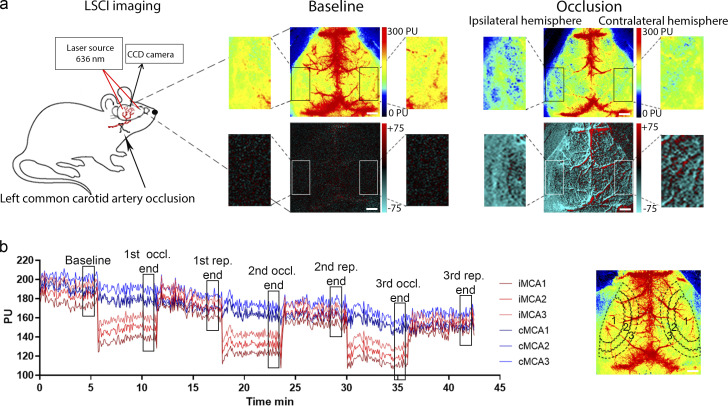
Figure S4.
CBF was measured during transient left CCAo through the intact skull bone by LSCI. (a) Representative perfusion (0–300 PU, on the top of a, and difference images (−75 to +75) on the bottom of a show baseline CBF and perfusion changes during CCA occlusion. Scale bar, 1 mm. (b) Representative graph showing the typical kinetics of repeated (3× CCA) occlusions on the areas (MCA1–3 areas) investigated on both hemispheres. ROIs are shown on a representative perfusion image on the right. Black rectangles on the kinetic graph display the sections of curves, which were used for detailed analysis. Scale bar, 1 mm.

