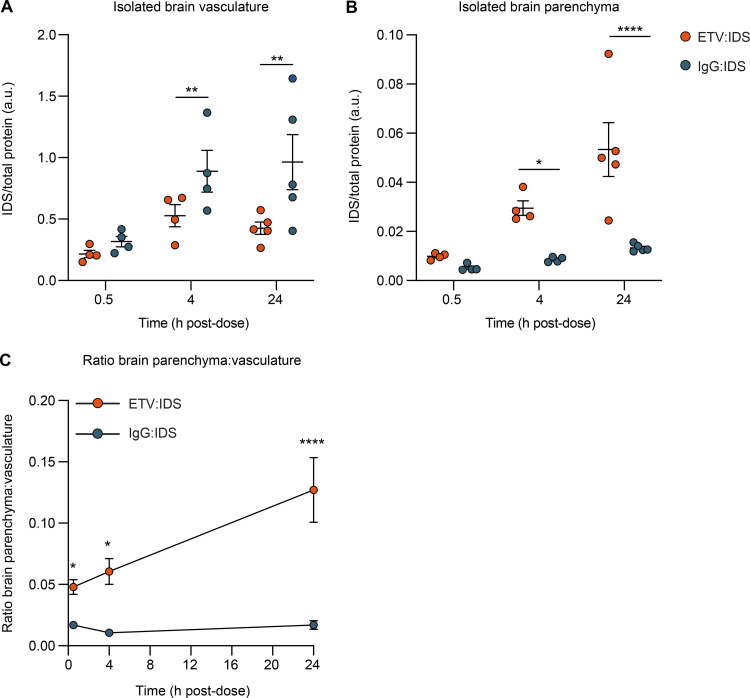
Figure 3.
Capillary depletion method demonstrates accumulation of ETV:IDS in the brain parenchyma and IgG:IDS in the brain vasculature. (A and B) Concentrations of ETV:IDS or IgG:IDS in the isolated brain vasculature (A) or brain parenchymal fraction (B) from TfRmu/hu KI mice were measured 0.5, 4, and 24 h after an IV dose of 10 mg/kg and determined using an IDS capture/IDS detect immunoassay. TfRmu/hu KI mice are on a C57BL/6 background. Data presented are from a single study. ELISA data represents the average of n = 2 technical replicates per mouse; each symbol represents a biological replicate with n = 4–5 mice per group. (C) Ratio of brain parenchyma to brain vasculature concentrations. Data presented are from a single study. ELISA data represent the average of n = 2 technical replicates per mouse; each symbol represents an average of n = 4–5 mice per group per time point. Graphs display mean ± SEM and P values: two-way ANOVA with Sidak’s multiple comparison test; *, P ≤ 0.05; **, P ≤ 0.01; ****, P ≤ 0.0001. a.u., arbitrary unit.

