Figure 4.
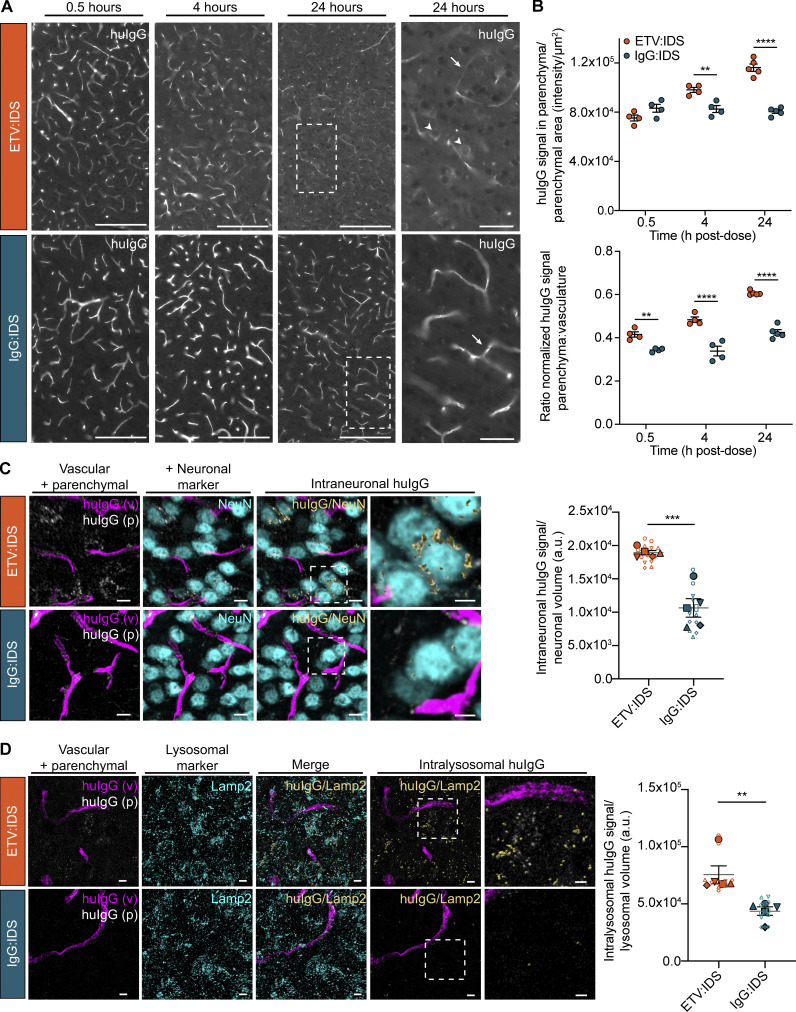
IHC localization of ETV:IDS demonstrates enhanced distribution into the brain parenchyma compared with IgG:IDS. The distribution of ETV:IDS and IgG:IDS was assessed using sagittal brain sections from TfRmu/hu KI mice 0.5, 4, and 24 h after an IV dose of 10 mg/kg. TfRmu/hu KI mice are on a C57BL/6 background. Schematic indicating approximate location of sagittal brain regions of interest (ROIs) for images and quantification is in Fig. S2 A. (A) Sections were immunostained with antibodies against huIgG, imaged, and post-stitched using a wide-field fluorescence slide scanner. Scale bars = 200 μm. Dashed boxes indicate cortical regions shown at higher magnification displayed in the far-right panel; scale bars = 50 μm. Arrows indicate huIgG staining localized to vascular profiles; arrowheads indicate cellular internalization of huIgG staining. (B) Quantification of huIgG staining in the parenchyma of the cortex was calculated based on the total sum intensity of all parenchymal staining in the ROI divided by the total parenchymal area in the ROI. A custom macro script was used to identify blood vessels present in the tissue and masked out of subsequent image analyses. The ratio of normalized huIgG signal in the brain parenchyma to brain vasculature was also quantified. Data presented are from a single study with n = 4–5 mice per group. Each symbol represents a biological replicate. Graphs display mean ± SEM and P values: two-way ANOVA with Sidak’s multiple comparison test; **, P ≤ 0.01; ****, P ≤ 0.0001. (C and D) Sagittal brain sections from TfRmu/hu KI mice 24 h after an IV dose of 10 mg/kg were immunostained with antibodies against huIgG and the neuronal marker NeuN (C) or huIgG and the endolysosomal marker LAMP2 (D). Confocal Z-stacks were acquired using SRCM. Scale bars = 10 μm. Dashed boxes indicate cortical regions shown at higher magnification displayed in the far-right panel; scale bars = 5 μm. For the analysis, huIgG-positive signal was segmented into vascular (magenta) and parenchymal (grayscale) components. Intraneuronal huIgG (yellow, shown with surface rendering; C) and intralysosomal huIgG (yellow, shown with surface rendering; D) was further segmented using either NeuN or LAMP2 (cyan) as a mask. In D, the merged panel shows both LAMP2 signal non-colocalized (cyan) and colocalized (yellow, shown with surface rendering) with huIgG signal. For better visualization, the subsequent intralysosomal panels show only the parenchymal LAMP2 signal that colocalized with huIgG (yellow). The intraneuronal (C) and intralysosomal (D) huIgG signal was quantified and normalized to the total neuronal volume or total lysosomal volume, respectively. Data presented are from a single study with n = 5 mice per group. Graphs display superimposed summary statistics from n = 5 mice (solid shapes) consisting of two to three different image volumes from each animal (open shapes). Each animal is coded by different shapes. The five means were then used to calculate the mean ± SEM and P values: unpaired t test analysis; **, P ≤ 0.01; ***, P ≤ 0.001. a.u., arbitrary unit.

