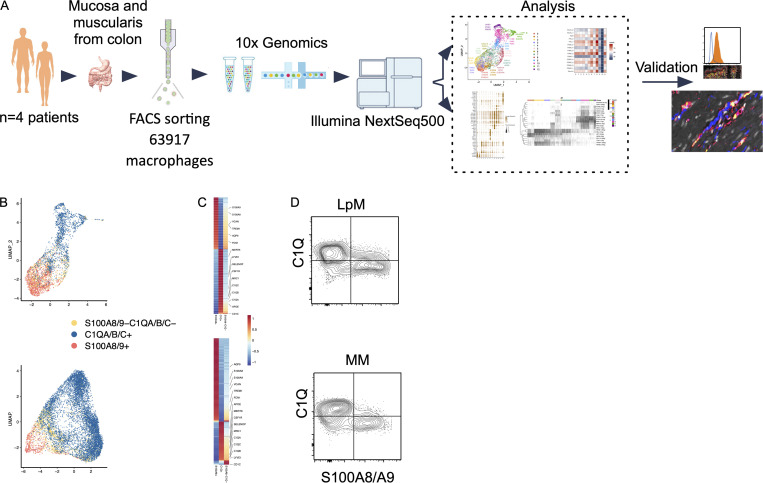
Figure 1.
Schematic overview of scRNA-seq analysis and identification of monocyte-like and TRMs in colonic mucosa and muscularis propria. (A) Schematic overview of scRNA-seq analysis. (B) UMAP plots showing expression of S100A8/A9+ (red), C1QA/B/C+ (blue), and S100A8/A9−C1QA/B/C− (yellow). The color among compartments is determined by its higher expression level. (C) Heatmap of DEGs by S100A8/A9+, C1QA/B/C+, and S100A8/A9−C1QA/B/C− cells. Selected genes are indicated. Expression levels are visualized from low expression (blue) to high expression (red). (D) Flow cytometry plots showing intracellular staining for C1Q and S100A8/S100A9 (calprotectin) in CD45+HLA-DR+CD14+ cells from mucosa (top) and muscularis propia (bottom). Gates were set based on staining with irrelevant isotype-matched antibodies. Representative of more than four experiments.

