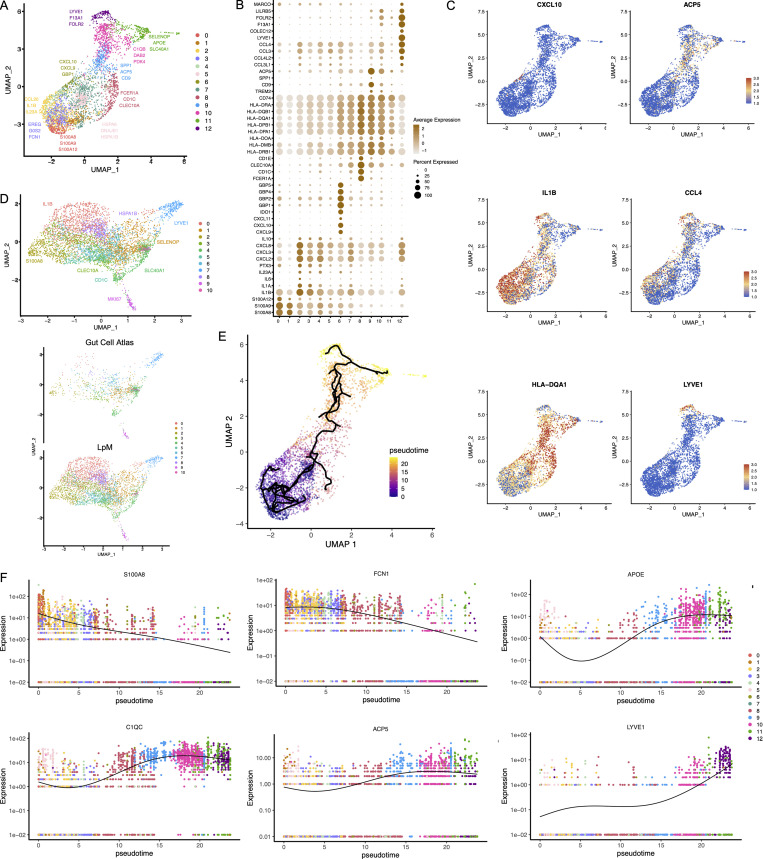
Figure 2.
Cluster analysis, differential gene expression identification, and pseudotime trajectories for LpMs. (A) UMAP representation of 13 clusters (different colors) with annotated highly expressed gene identity within selected clusters. (B) Dot plot of average expression of selected genes. Expression levels are visualized from low (white) to high (brown) expression. The percentage of positive cells is indicated by circle size. (C) UMAP visualization of selected genes. Expression levels are visualized from low (blue) to high (red) expression. (D) UMAP of integrated analysis of LpMs and mucosal macrophages from the Gut Cell Atlas (Elmentaite et al., 2021). (E) Reconstructed developmental trajectory of LpMs showing pseudotime colored from blue to yellow. (F) Expression for some selected gene expression through pseudotime. Cell colors represents clusters.

