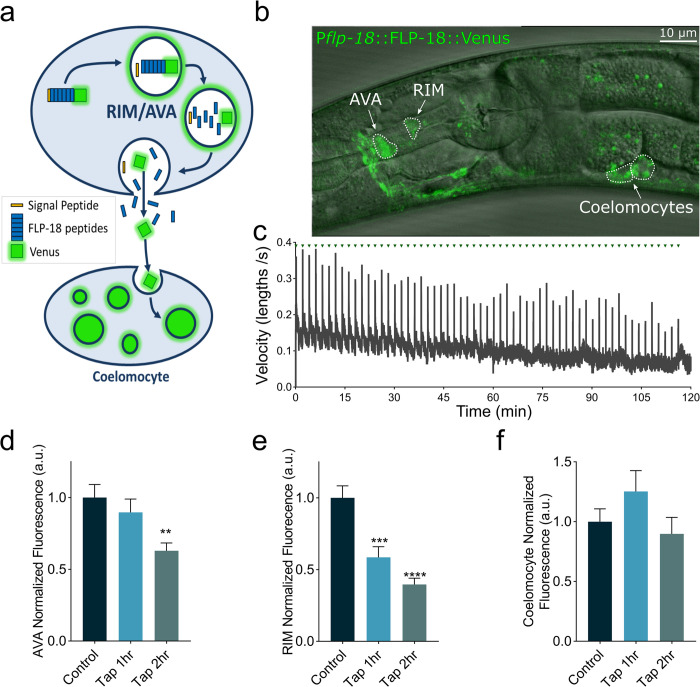
Fig 4. The escape response stimulates FLP-18 release from the AVA and RIM.
Animals expressing a FLP-18::Venus fusion protein were subjected to repeated mechanical plate taps. The decrease in fluorescent intensity of the RIM and AVA cell bodies and the anterior-most coelomocyte were quantified as a readout of FLP-18 release. (A) Schematic illustrating the processing and exocytosis of the FLP-18::Venus fusion protein. (B) Representative image showing an animal expressing FLP-18::Venus, DIC and GFP overlay. Scale bar represents 10 μm. (C) Average velocity of a population of animals as they are subjected to mechanical plate taps. Green arrows indicate the delivery of a tap every 2 min. The spikes in velocity coincide with the initiation of the escape response (D-E) Quantification of fluorescence (arbitrary units–a.u.) in the AVA (D), RIM (E), and coelomocytes (F), at 0-, 1- and 2-hour time points. Graphs represent mean ± SEM, significance was calculated using ANOVA with Dunnett’s multiple comparison test (P<0.005 = **, P<0.0005 = ***, P<0.0001 = ****). Sample size: (C) n = 3 replicates, >30 animals per replicate. (D-F) Control (n = 32), Tap 1 hr. (n = 26), Tap 2 hr. (n = 35).

