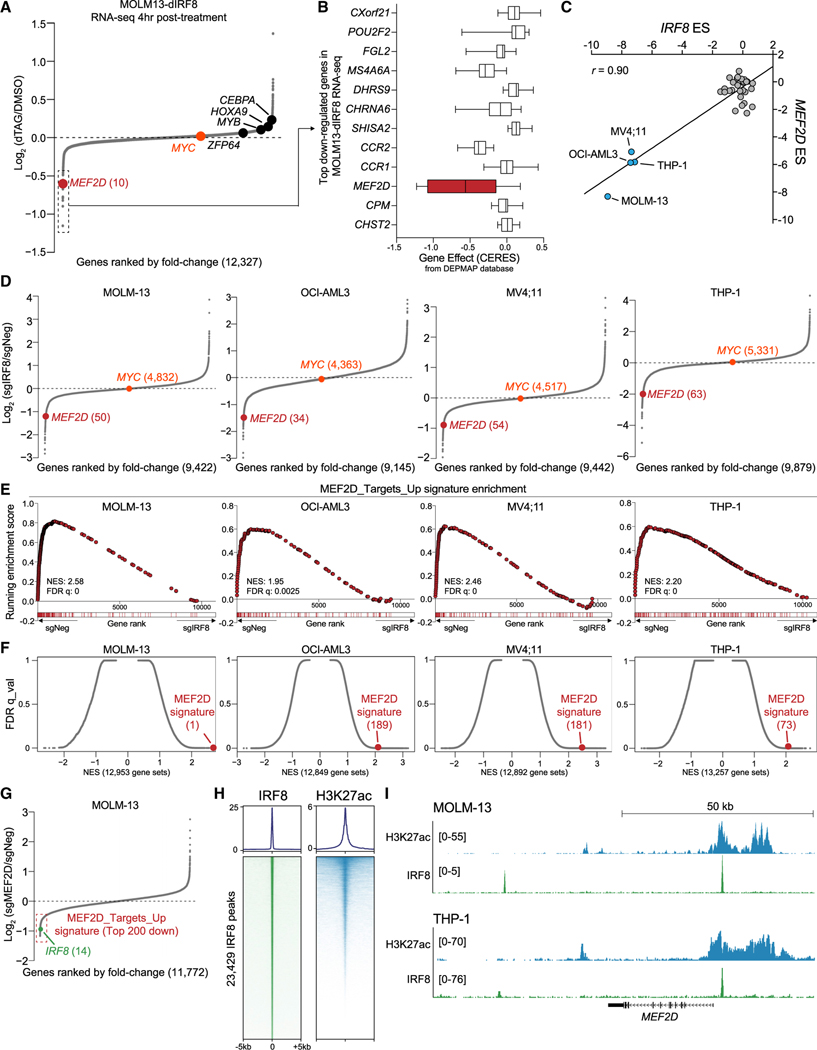
Figure 2. IRF8 is enriched at the MEF2D locus and modulates MEF2D expression.
(A) RNA-seq analysis of gene expression changes in MOLM-13-dIRF8 cells treated with either DMSO or 500 nM of dTAG-47 for 4 h. Genes are ranked by log2 fold change (n = 3).
(B) ESs of top 12 downregulated genes from DEPMAP dataset with log2 fold change less than —0.5 in IRF8-expressed (TPM > 1) AML cell lines (n = 12). Shown is a box and whisker plot of copy-number-adjusted ESs (CERES). TPM, transcripts per million reads.
(C) Scatterplot of IRF8 and MEF2D essentiality scores in 33 human cancer cell lines extracted from Lu et al. (2018). IRF8hi cell lines are labeled. r, Pearson’s correlation coefficient.
(D) RNA-seq analysis of gene expression changes in indicated cell lines transduced with sgIRF8 or sgNeg for 4 days. sgNeg and two independent sgRNAs targeting IRF8 are used (n = 2 biological replicates per sgRNA). Ranking position from the top most downregulated gene is indicated in parentheses.
(E) GSEA rank plot of RNA-seq data presented in (D). The MEF2D signature is defined as the top 200 downregulated genes upon MEF2D depletion. Normalized enrichment score (NES) and false discovery rate (FDR) q value are shown.
(F) Unbiased GSEA using all signatures from MSigDB v6.1 (Liberzon et al., 2015), together with the MEF2D signature for RNA-seq data presented in (D). Each gene set is represented as a single dot. The MEF2D signature is indicated in red, with numeral rank from the top most-enriched gene set in parentheses.
(G) RNA-seq analysis of gene expression changes in MEF2D-depleted MOLM-13 cells 5 days after transduction of sgNeg or sgMEF2D. Two independent sgRNAs targeting either MEF2D or a negative control locus were used. MEF2D signature genes are indicated with a red box.
(H) Metaplot (top) and density plot (bottom) showing enrichment of IRF8 and H3K27ac surrounding the 23,429 IRF8 ChIP-seq peaks at a ±5-kb interval in MOLM-13 cells. Peaks were ranked by IRF8 ChIP-seq tag counts.
(I) Gene tracks of H3K27ac and IRF8 enrichment at the MEF2D locus in the indicated leukemia cell lines. H3K27ac and IRF8 ChIP-seq tracks in THP-1 cells are extracted from GSE123872.

