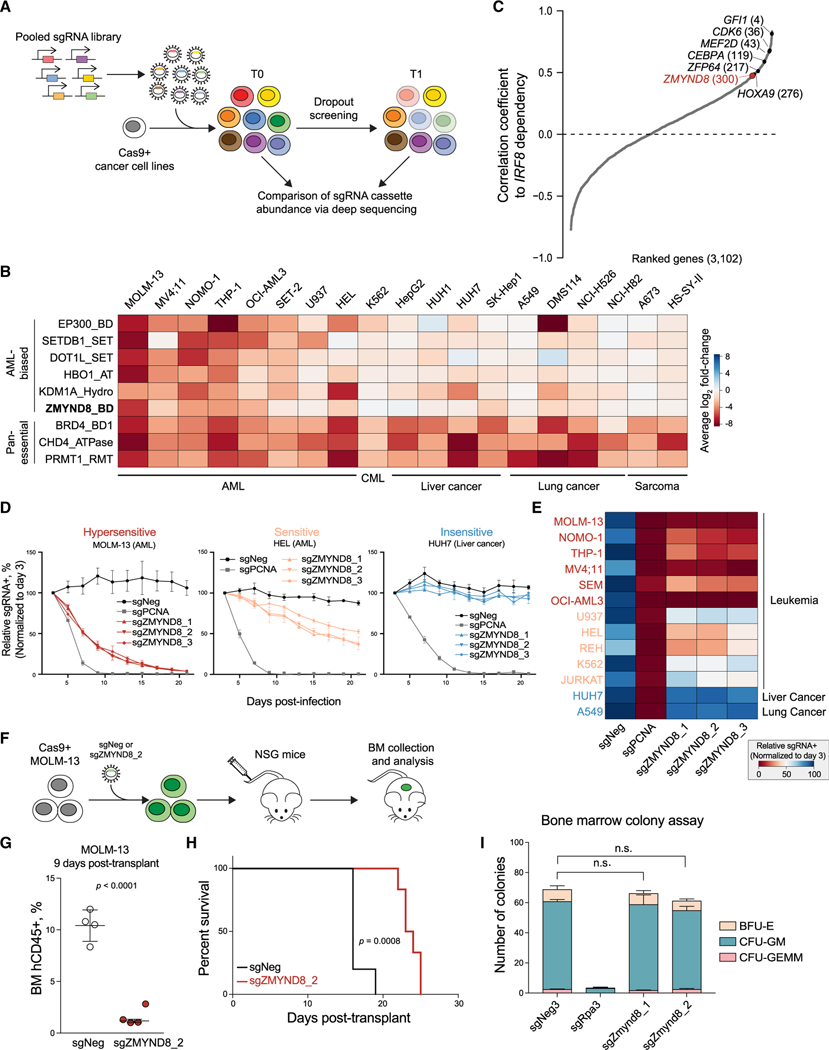
Figure 3. CRISPR screens identify ZMYND8 as an AML-biased dependency.
(A) Schematic showing the workflow of CRISPR dropout screen.
(B) Summary of CR domain-focused CRISPR screens. Genes were ranked by AML-biased ES. A673 and HS-SY-II screening data were retrieved from Brien et al. (2018).
(C) Correlated essentiality between IRF8 and 3,102 gene ESs from genome-wide CRISPR screens in leukemia cells (Wang et al., 2017). Pan-essential and nonessential genes are excluded. Remaining gene ESs were ranked by Pearson’s correlation coefficient to IRF8 ES.
(D) Competition-based proliferation assays performed in indicated Cas9+ cell lines (n = 3).
(E) Heatmap summarizing the competition-based proliferation assays performed as in Figure 3D (n = 3).
(F) Schematic of in vivo transplantation of MOLM-13 cells infected with sgNeg or sgZMYND8_2.
(G) Flow cytometry analysis of percentage of human CD45+ leukemia cells in BM of recipient mice sacrificed after 9 days post-transplantation (n = 4). Statistical analysis (p value) was performed using an unpaired Student’s t test. BM, bone marrow.
(H) Kaplan-Meier survival curves of recipient mice transplanted with MOLM-13 cells transduced with sgNeg (n = 5) or sgZMYND8_2 (n = 6). The p value was determined by a log-rank Mantel-Cox test.
(I) Colony formation of normal myeloid progenitor cells isolated from constitutively expressing Cas9 mice (n = 3). Statistical analysis was performed using a two-way ANOVA test.
Error bars represent mean ± SEM. See also Figure S3 and Table S2.

