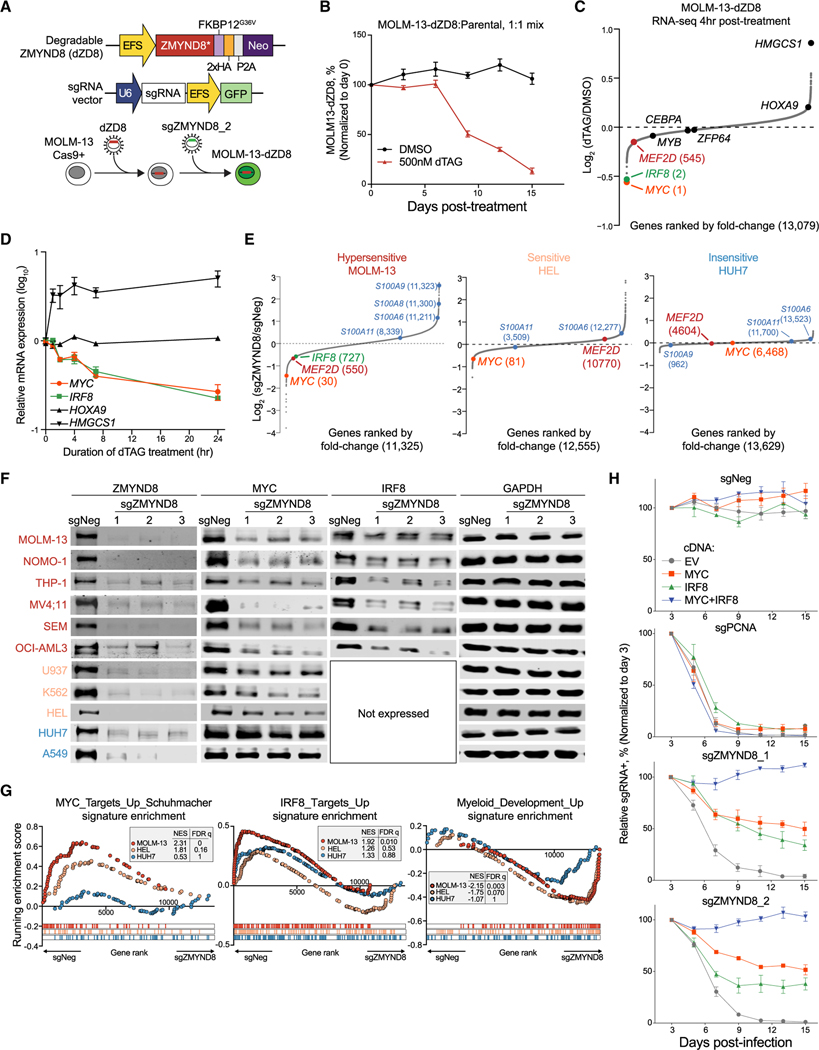
Figure 4. ZMYND8 regulates IRF8 and MYC transcription to sustain AML proliferation.
(A) Schematic depicting establishment of an inducible ZMYND8 degradation system in MOLM-13 cells.
(B) Competition-based proliferation assay of MOLM-13-dZD8 versus parental cells.
(C) RNA-seq analysis of gene expression changes in MOLM-13-dZD8 cells treated with either DMSO or 500 nM dTAG-13 for 4 h (n = 2).
(D) Time-course reverse transcriptase quantitative PCR (RT-qPCR) analysis of mRNA expression in MOLM-13-dZD8 cells treated with 500 nM dTAG-47. Relative mRNA levels were normalized to GAPDH levels.
(E) RNA-seq analysis of gene expression changes 5 days after transduction of sgNeg or sgZMYND8. Myeloid-differentiation-associated genes are labeled in blue.
(F) Immunoblotting of ZMYND8, MYC, IRF8, or GAPDH in whole-cell lysates.
(G) GSEA of RNA-seq data presented in Figure 4A. Myc_Targets_Up_Schuhmacher (Schuhmacher et al., 2001) and IRF8_Targets_Up or Myeloid_development_Up (Brown et al., 2006) signatures were used.
(H) Competition-based proliferation assays performed in MOLM-13 cells expressing EV, MYC, IRF8, or MYC+IRF8 and transduced with indicated sgRNAs. EV, empty vector.
Data points in line graphs represent the average of three independent biological replicates (n = 3). Error bars represent mean ± SEM. See also Figure S4 and Table S1.

