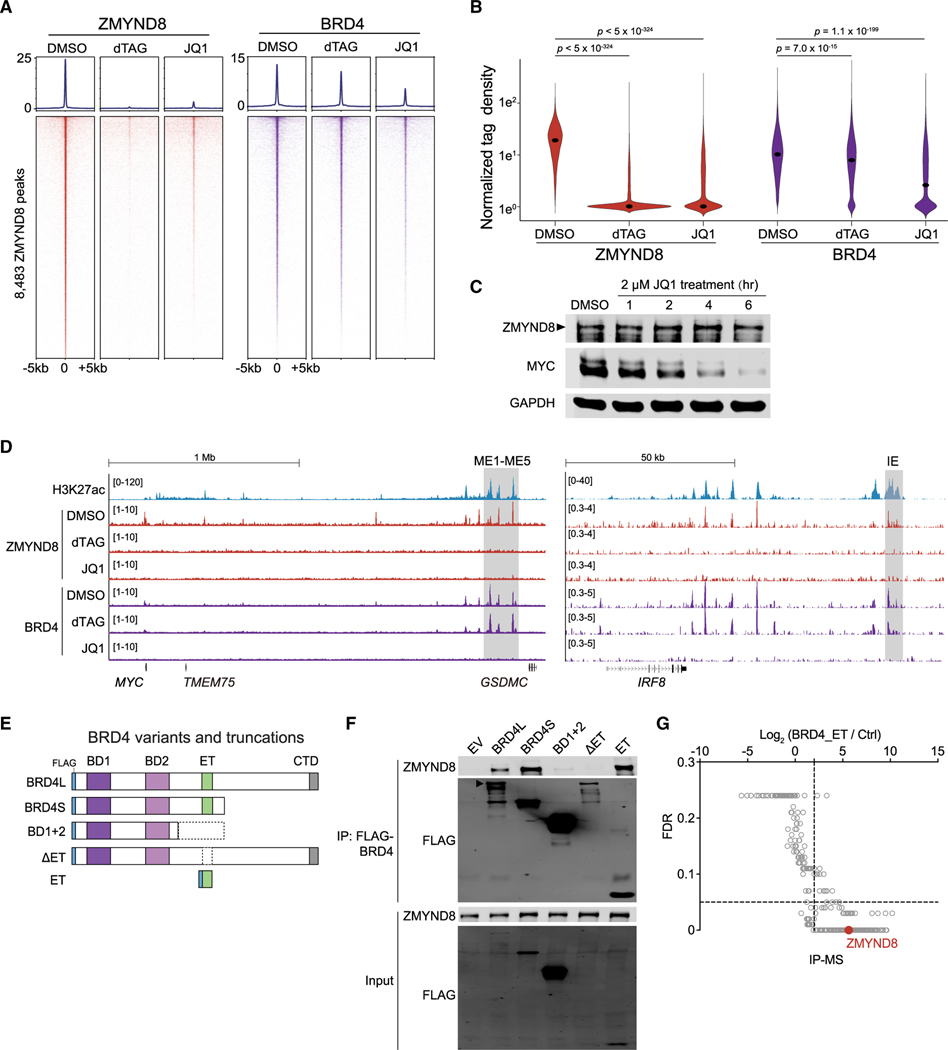
Figure 6. ZMYND8 occupies active elements in AML through binding the ET domain of BRD4.
(A) CUT&RUN meta-profile (top) and density plot (bottom) of ZMYND8 and BRD4 enrichment at 8,483 ZMYND8-occupied regions. Cells were treated with DMSO, 500 nM dTAG-47, or 2 μM JQ1 for 4 h.
(B) Violin plot of normalized tag density of ZMYND8 (red) or BRD4 (purple) peaks in Figure 6A. Dots represent median values. p values were calculated by Welch’s two-sided t test.
(C) Immunoblotting of MOLM-13-dZD8 whole-cell lysate treated with DMSO or 2 μM JQ1 over time.
(D) Gene tracks of H3K27ac, ZMYND8, and BRD4 enrichment at the leukemic MYC (left, ME1-ME5, gray box) or IRF8 enhancers (right, IE, gray box) regions in cell populations described in Figure 6A.
(E) Schematic of FLAG-tagged BRD4 variants and truncations used for coIP.
(F) IP-immunoblotting of nuclear lysates prepared from HEK293T cells transfected with indicated vectors for 48 h. Arrowhead represents the expected BRD4-long isoform (BRD4L) band.
(G) IP-MS analysis on nuclear lysates prepared from HEK293T cells transiently expressing the FLAG-ET domain or a streptavidin bead control. ZMYND8 peptide enrichment is labeled in red. Data were extracted from Lambert et al. (2019).
See also Figure S6.

