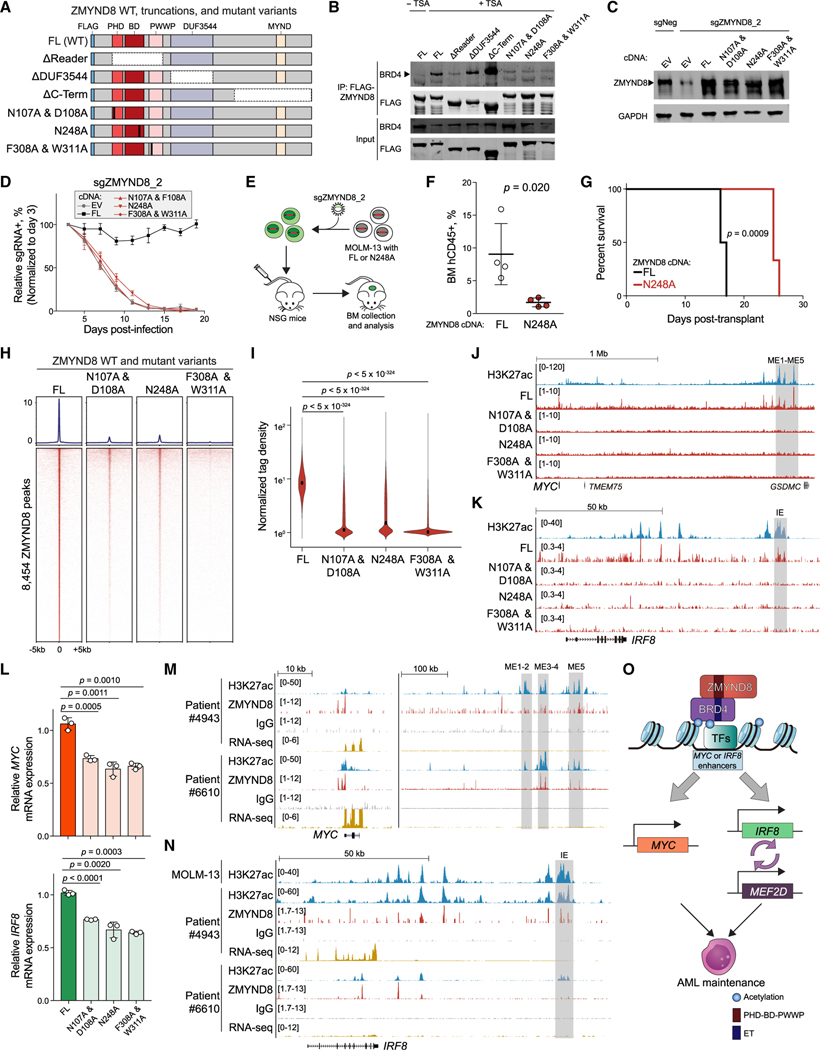
Figure 7. ZMYND8 PHD-BD-PWWP reader cassette is required for association with BRD4 on chromatin and leukemia growth.
(A) Schematic of FLAG-tagged constructs used for coIP. FL, full-length. Vertical black bars represent mutagenized amino acid sites.
(B) IP-immunoblotting of nuclear lysates prepared from HEK293T cells. TSA, trichostatin A. Arrowhead represents the expected BRD4 size. (n = 3).
(C) Immunoblotting of nuclear lysates prepared from MOLM-13 cells stably expressing EV, FL, or mutated ZMYND8 cDNA and transduced with sgNeg or sgZMYND8_2. Arrowhead represents the expected ZMYND8 band.
(D) Competition-based proliferation assays performed in MOLM-13 cells stably expressing the indicated cDNA and sgZMYND8_2 (n = 3).
(E) Schematic of in vivo engraftment of MOLM-13 cells expressing FL or BD-mutated (N248A) ZMYND8.
(F) Flow cytometry analysis of human CD45+ leukemia cells in BM of recipient mice (n = 4). Statistical analysis was performed using unpaired Student’s t test. BM, bone marrow.
(G) Kaplan-Meier survival curves of recipient mice transplanted with MOLM-13 cells expressing WT or BD-mutated (N248A) ZMYND8 and transduced with sgNeg or sgZMYND8_2 (n = 6). p value determined by a log-rank Mantel-Cox test.
(H) CUT&RUN meta-profile (top) and density plot (bottom) of ZMYND8 enrichment at 8,454 FL-ZMYND8-occupied regions in MOLM-13 cells. MOLM-13 cells stably expressing FL or mutated ZMYND8 were transduced with sgZMYND8_2 and collected 5 days post-infection.
(I) Violin plot of normalized tag density of ZMYND8 peaks in (H). Black dots represent median values. p values were calculated by Welch’s two-sided t test.
(J and K) Gene tracks of ZMYND8 enrichment at the leukemic MYC (J) or IRF8 (K) enhancer regions in cells described in (H). Enhancer regions are shown in gray boxes.
(L) RT-qPCR analysis of mRNA expression of MYC (top) or IRF8 (bottom) in cells described in (H) (n = 3).
(M and N) Gene track of H3K27ac and ZMYND8 enrichment at MYC (M) and IRF8 (N) regions in two primary AML patient blasts. RNA-seq data are also shown.
(O) Model of how ZMYND8 regulates the IRF8-MEF2D and MYC axis in AML.
Error bars represent mean ± SEM. See also Figure S7.

