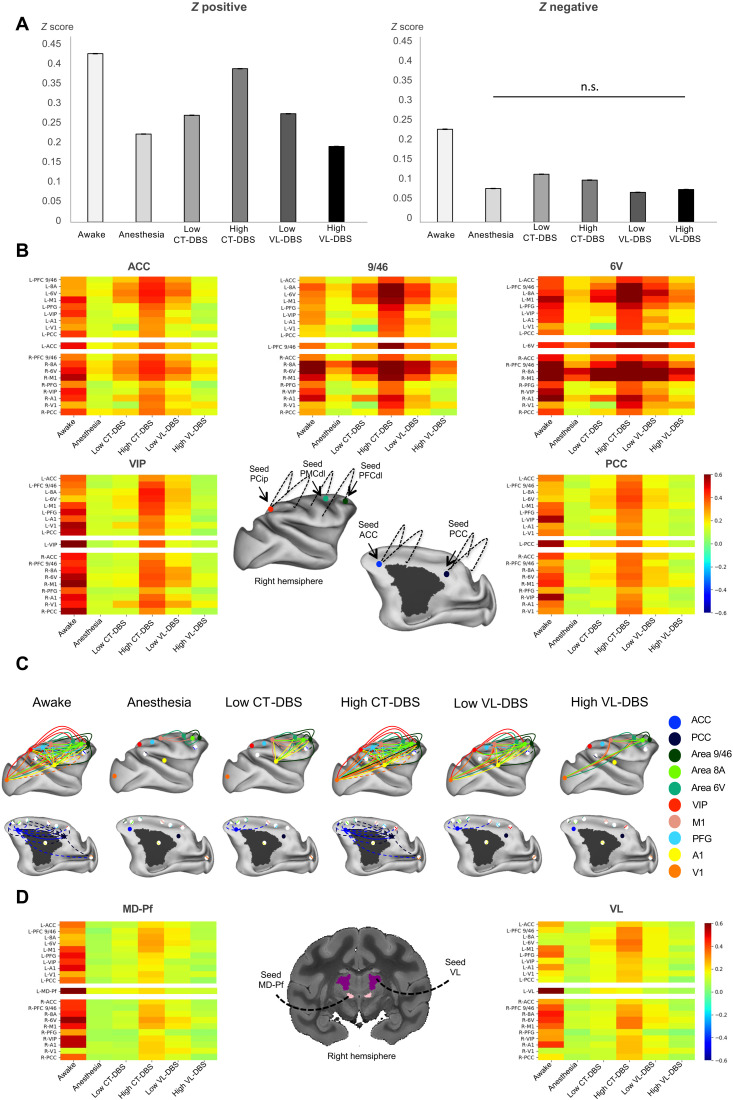
Fig. 4. Central thalamic stimulation restores thalamocortical and corticocortical static connectivity in anesthetized macaques.
(A) Average positive and negative z values within each experimental condition. In all plots, error bars represent 1 SEM. All pairwise comparisons between experimental conditions are significantly different (P < 0.001) both for positive and negative z values, except for the negative z value comparison between anesthesia and high VL-DBS (n.s., not significant). (B) Effects of DBS on corticocortical FCs. Average connectivity matrices displaying intervoxel correlations between selected cortical regions of interest (ROIs) of the “macaque” GNW (ACC; area 9/46; area 8A, area 6V, VIP, and PCC) under different experimental conditions. x axis, arousal state; y axis, studied regions. For each region, the matrix represents the FCs between the defined seed (in the right hemisphere) and the remaining selected regions. (C) Effects of DBS on corticocortical FCs. Schematic representation of the cortical static correlations of the macaque GNW nodes (ACC, PCC, PFCdl, FEF, PMCdl, and Pcip) and M1, S1, V1, and A1; correlation strengths higher than 0.3 of the right hemisphere for the different experimental conditions. (D) Effects of DBS on thalamocortical FCs. Average connectivity matrices displaying intervoxel correlations between selected thalamic nuclei and cortical ROIs representing the macaque GNW (ACC; area 9/46; area 8A, area 6V, VIP, and PCC) under different experimental conditions. x axis, arousal state; y axis, studied regions. For each region, the matrix represents the FC between the defined seed (in the right hemisphere) and the remaining studied areas. Area 9/46 (PFCdl); area 8A (part of FEF) and area 6V (PMCdl); area M1, primary motor cortex; area A1, primary auditory cortex; VIP: Pcip.

