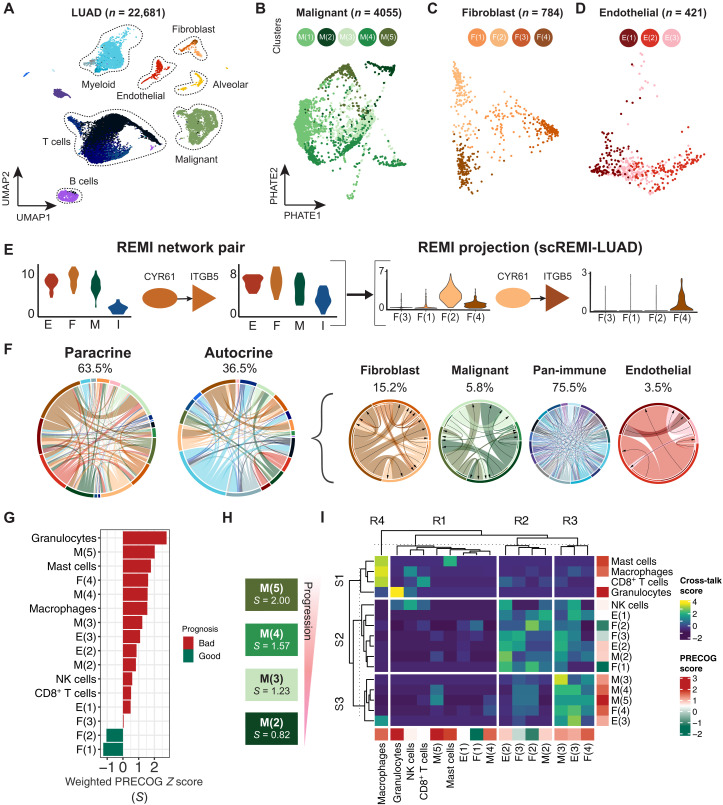
Fig. 4. Projecting scRNA-seq information onto LUAD interactome reveals prognostic progression in malignant subpopulations.
(A) Uniform manifold approximation and projection (UMAP) of Lambrecht et al. lung carcinoma scRNA-seq dataset (n = 22,681 cells, two patients). (B) PHATE (potential of heat diffusion for affinity-based transition embedding) representation of malignant cell population and its five subpopulations (n = 4055 cells). (C) PHATE representation of fibroblast population and its four subpopulations (n = 784 cells). (D) PHATE representation of endothelial population and its three subpopulations (n = 421 cells). (E) Deconvolution pipeline of REMI interactome using scRNA-seq. The example shows one LR pair where its cell type node label is relabeled by the single-cell subpopulation labels. (F) Proportion of interactions involving each cell type in scREMI-LUAD. Two chords on the left show interactions that were labeled as paracrine and autocrine in REMI-LUAD. Four chords on the right show that the interactions that were previously labeled as autocrine are now labeled as paracrine signaling interactions between subpopulations. (G) Weighted prognosis scores for each subpopulation. (H) Progression of malignant subpopulations ranked from poor to good prognosis. S indicates prognosis score value. (I) Clustered cell-cell interaction cross-talk scores between cell subpopulations. Cross-talk score represents the variability of the number of LR interactions between two cell types with respect to the sending cell type. Cell types are labeled by weighted prognosis score.

