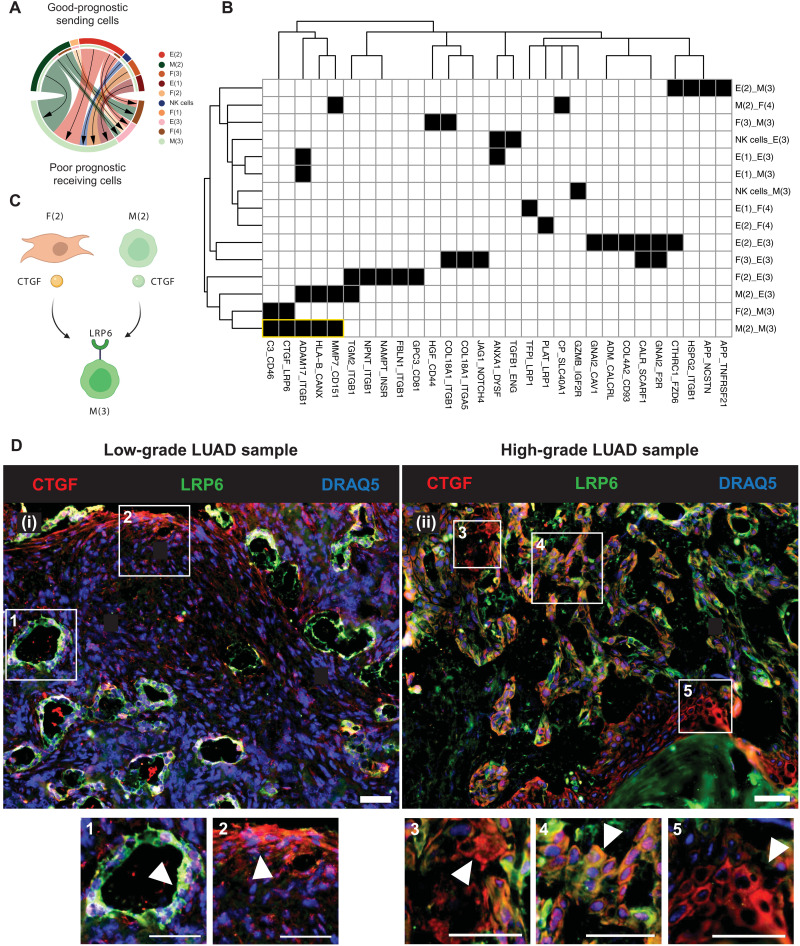
Fig. 5. Cell-cell interaction associated with progression in LUAD.
(A) Circle plot indicates ratio of interactions occurring in mixed-prognostic subpopulations. The color of the chords corresponds to the legend on the right. Arrows point from sending to receiving cell types. NK, natural killer. (B) Binarized heatmap of cell-cell interactions between good-prognostic sending subpopulations and poor-prognostic receiving subpopulations. Interactions were filtered by average receptor expression >0.5. Black indicates a predicted cell-cell interaction between LR. White indicates no LR interaction prediction. Yellow box highlights interactions occurring between M(2) and M(3). (C) Diagram of CTGF:LRP6 interactions predicted by scREMI-LUAD. (D) Immunofluorescence (IF) staining analysis of CTGF (red), LRP6 (green), and DRAQ5 (blue) in fresh-frozen LUAD samples from patients with low-grade (i) versus high-grade (ii) disease. In (i), box nos. 1 and 2 contain CTGF−LRP6+ malignant cells and CTGF+LRP6− fibroblast cells, respectively (see H&E in fig. S6). In (ii), box nos. 3, 4, and 5 contain CTGF+LRP6− malignant cells, CTGF+LRP6+ colocalized malignant cells, and CTGF+LRP6− bronchial cells with potential malignancy, respectively. Scale bars, 50 μm.

